


- What is a Chart?
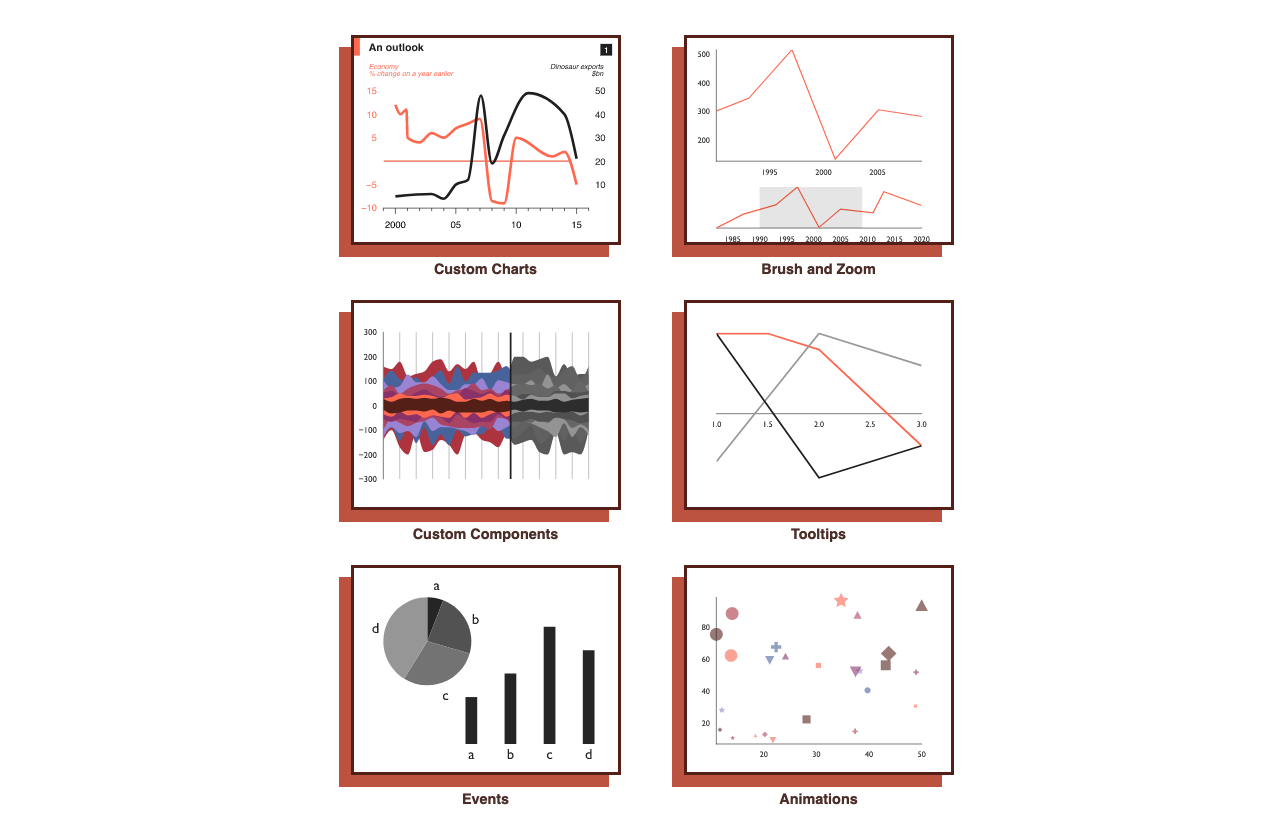
- Recharts
- Victory
- Nivo
- React-chartjs-2
- React-vis
- React-time-series charts
- BizCharts
- Visx
- React Stockcharts
- Ant Design Chart
- eChart for React
- React-financial-charts
- Rumble-charts
- C3.js
- Canvas.js
- Chartist.js
- Cubism.js
- Other Chart Libraries
- Recommended Resources
- Interesting Reads From Our Blogs
- Conclusion
- Easily Convert Figma Design to Code
Data has become an important part of our lives. Graphs and charts are useful for displaying statistical data gained from the databases meaningfully. There are many open-source libraries helping to portray data in different graphs and charts.
The first step is knowing which library is best for your React apps or React Native apps data visualization process. While it can be difficult to know which one is perfect for a project, this article will help guide you on the different charting libraries that you can choose from for your next app project.
What is a Chart?
A chart is a graphical representation used for visualizing data. A chart can be represented by symbols that give quality structure such as bars, lines, slices in a pie chart, etc.
Here are the top 33 free react chart libraries:
Recharts
Recharts is one of the oldest chart libraries for any react app that help build charts with reusable React components.
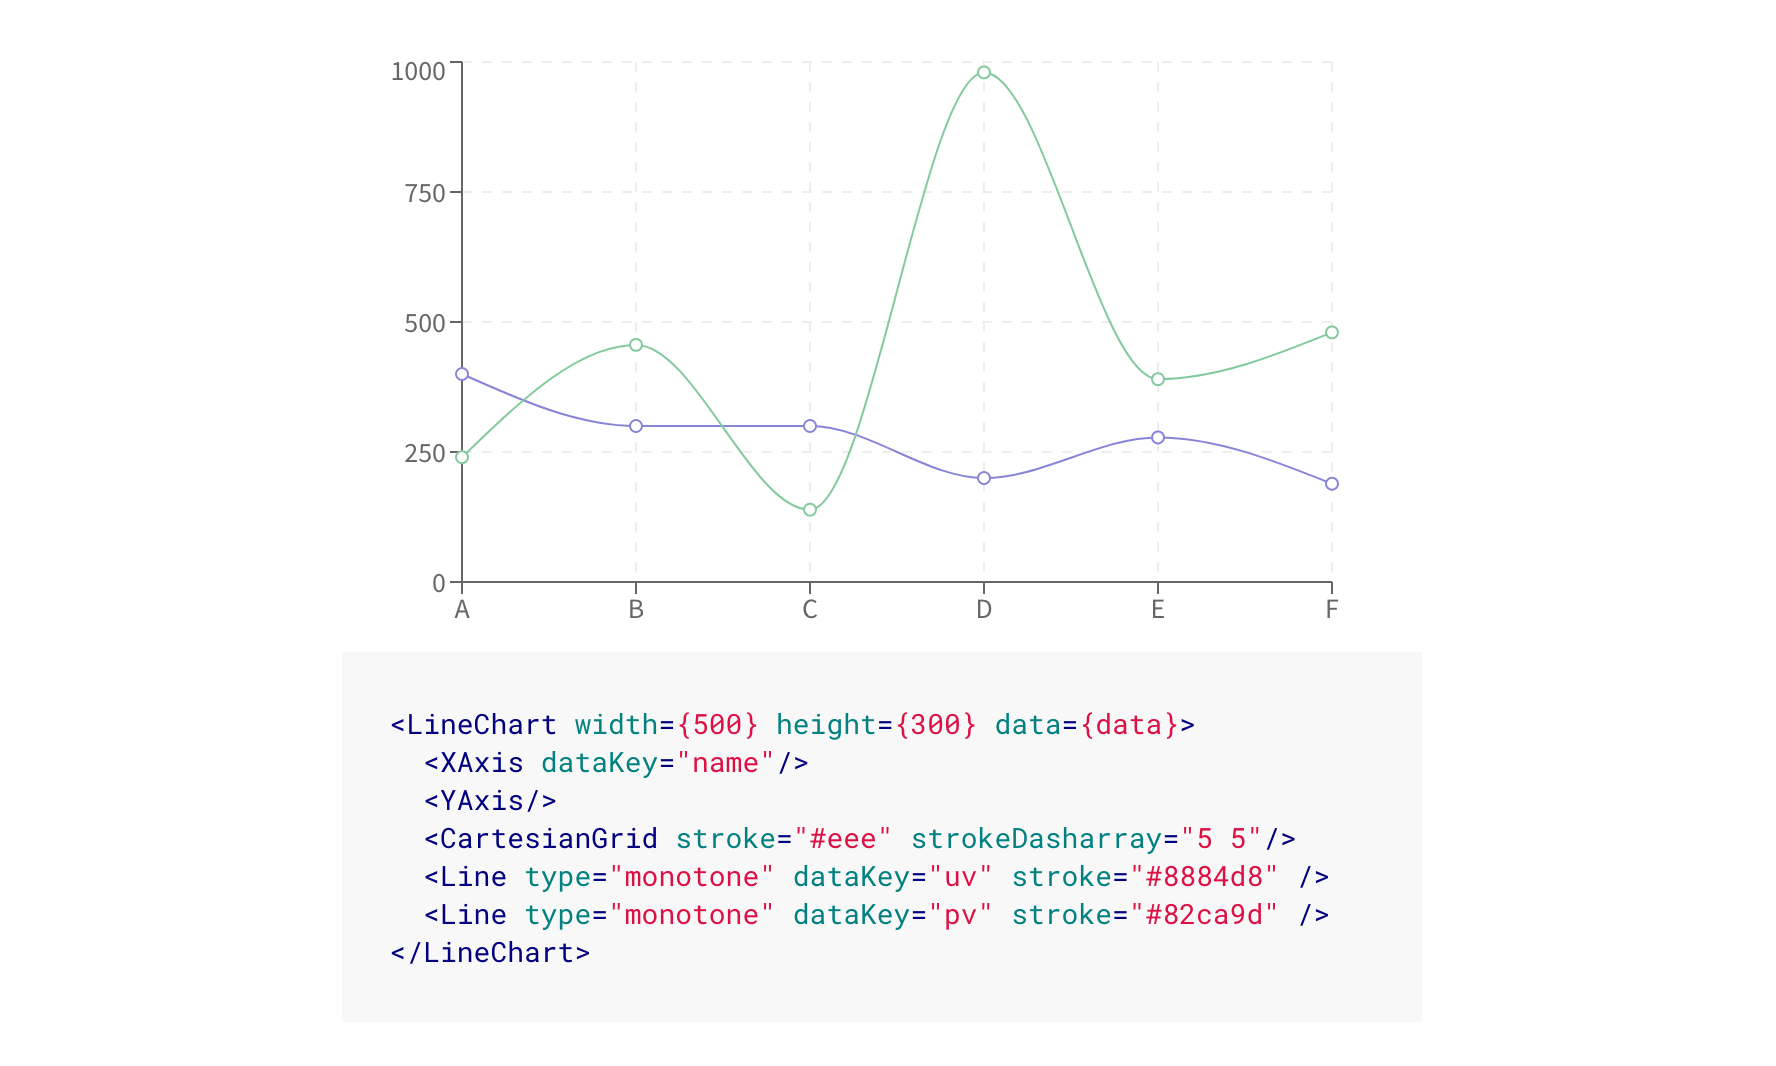
It features native SVG support, with only light dependency on some D3 submodules. Rechartscomes with the following features:
- Beautiful charts out-of-the-box
- Tweaking of existing components or adding custom components
- Native SVG support
- Declarative components
Victory
Victory is another react charting library which comes with charting components and uses a uniform API for all apps – react for web and react native for mobile.
It is easy to use and supports cross-platform charting. This library also provides;
- Integration of various chart formats such as line, pie, bar, and candlestick on web and Native Applications.
- Cross-Platform charting support
- Animations and transitions
- Customizable components
Nivo
Nivo is another charting library for React apps. Its ability to render on the server-side also makes it stand out from the other chart libraries for React.
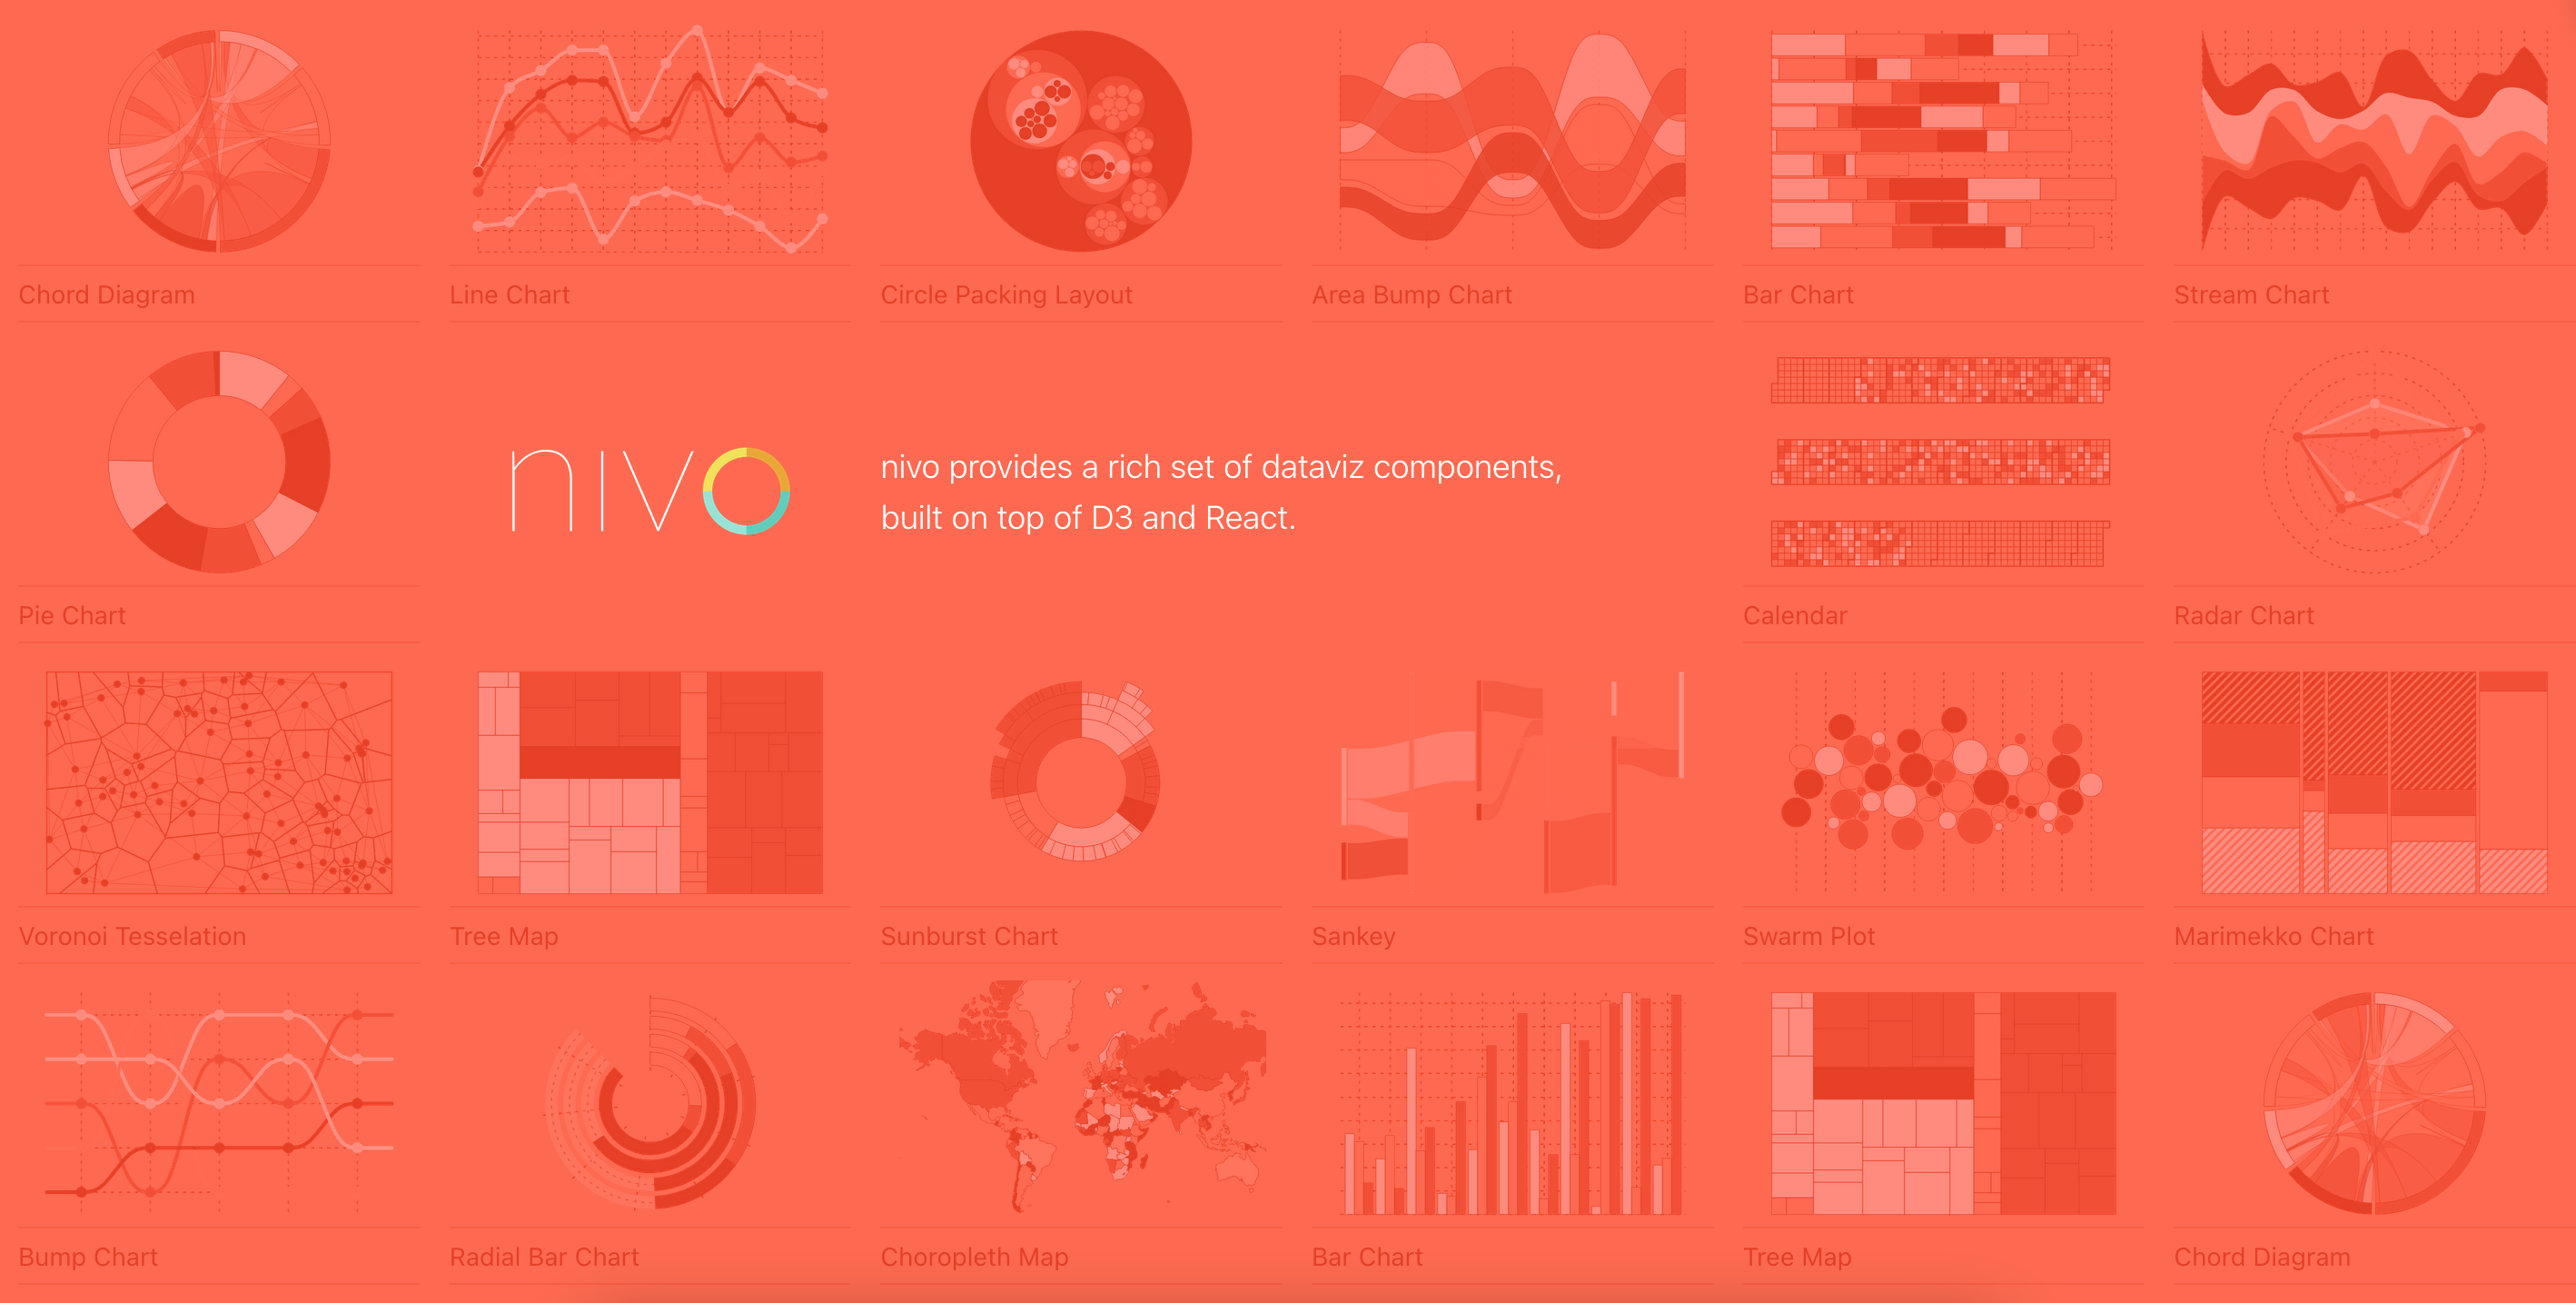
Developers can easily get varieties of templates of useful data visualization charts and graphs from the extensive component library which nivo provides. This library provides the following;
- Support for HTML, Canvas, and SVG charts in a single library
- Support for motion/transitions backed by React-motion
- Decent customization options
- In-built support for responsive charts
- Ability to render on server-side
React-chartjs-2
React-chartjs-2 is not really among the charting libraries available for building react charts. Actually, this library is used as a React wrapper for chart.js.
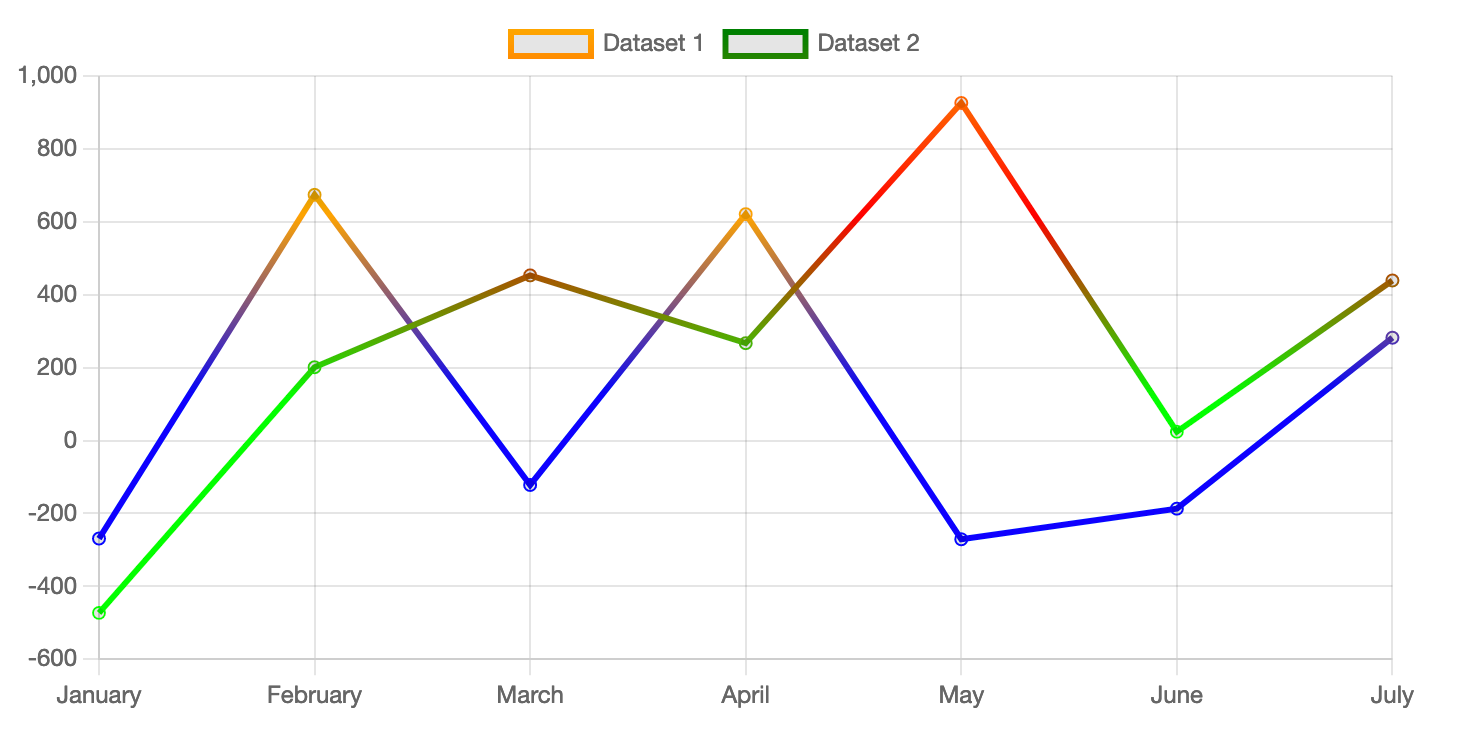
It is ideal for any React application without a complicated dataset that requires only just few customization tweaks. The library comes with the following;
- 6 Different Chart Styles out-of-the-box
- Support for Animations
- Responsive Charts
- Customization Options
React-vis
React vis is one of the most beginner-friendly chart libraries available for React applications built by Uber.
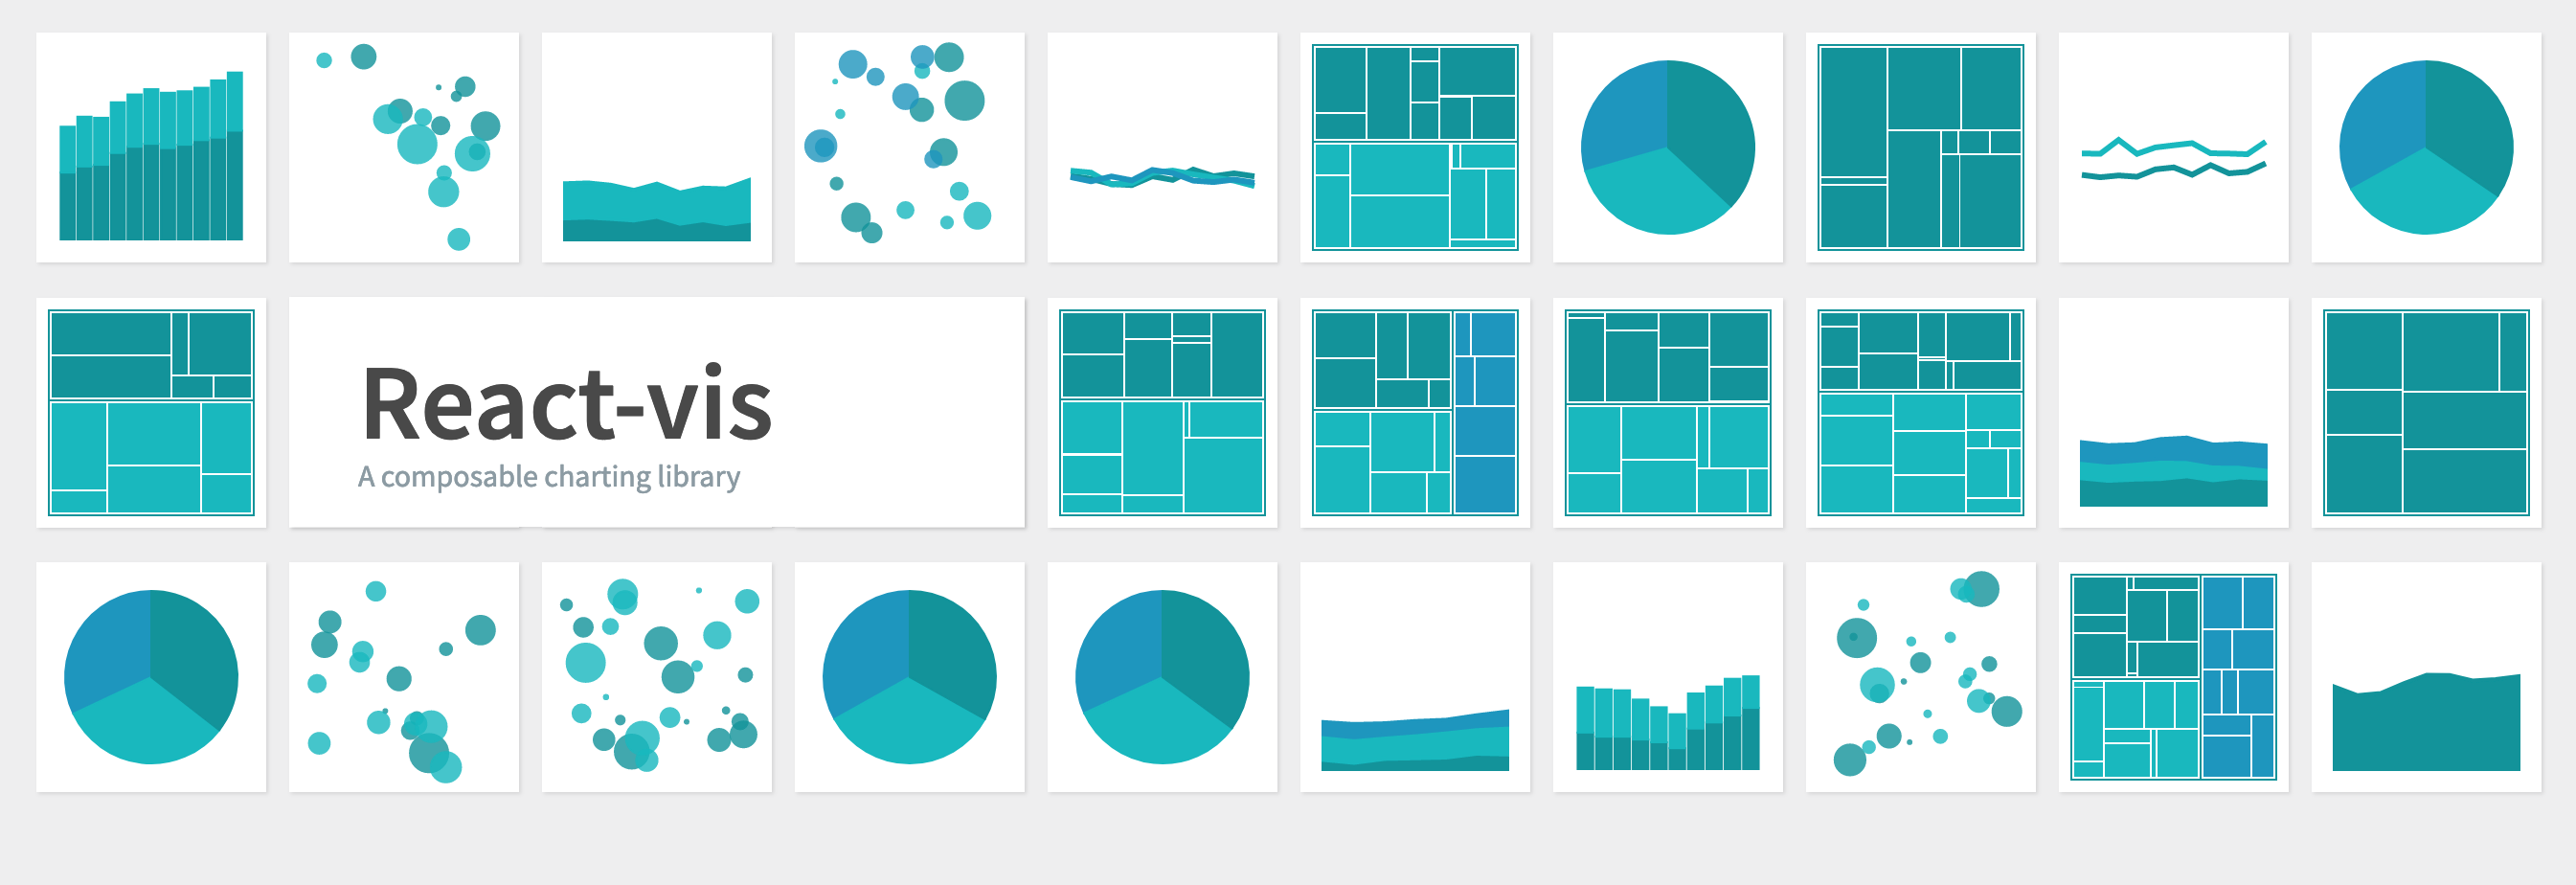
React vis is one of the data visualization libraries that has a collection of React components that developers can use to render common data visualization charts. React vis comes with the following features;
- React vis is a beginner-friendly charting solution for React developers
- Flexibility for different types of charts
- Ease of use
- Seamless integration into React environment
React-time-series charts
React time series chart is a React charting library that focuses on time series components. It contains a set of modular charting components created specifically to visualize time series and network traffic data.
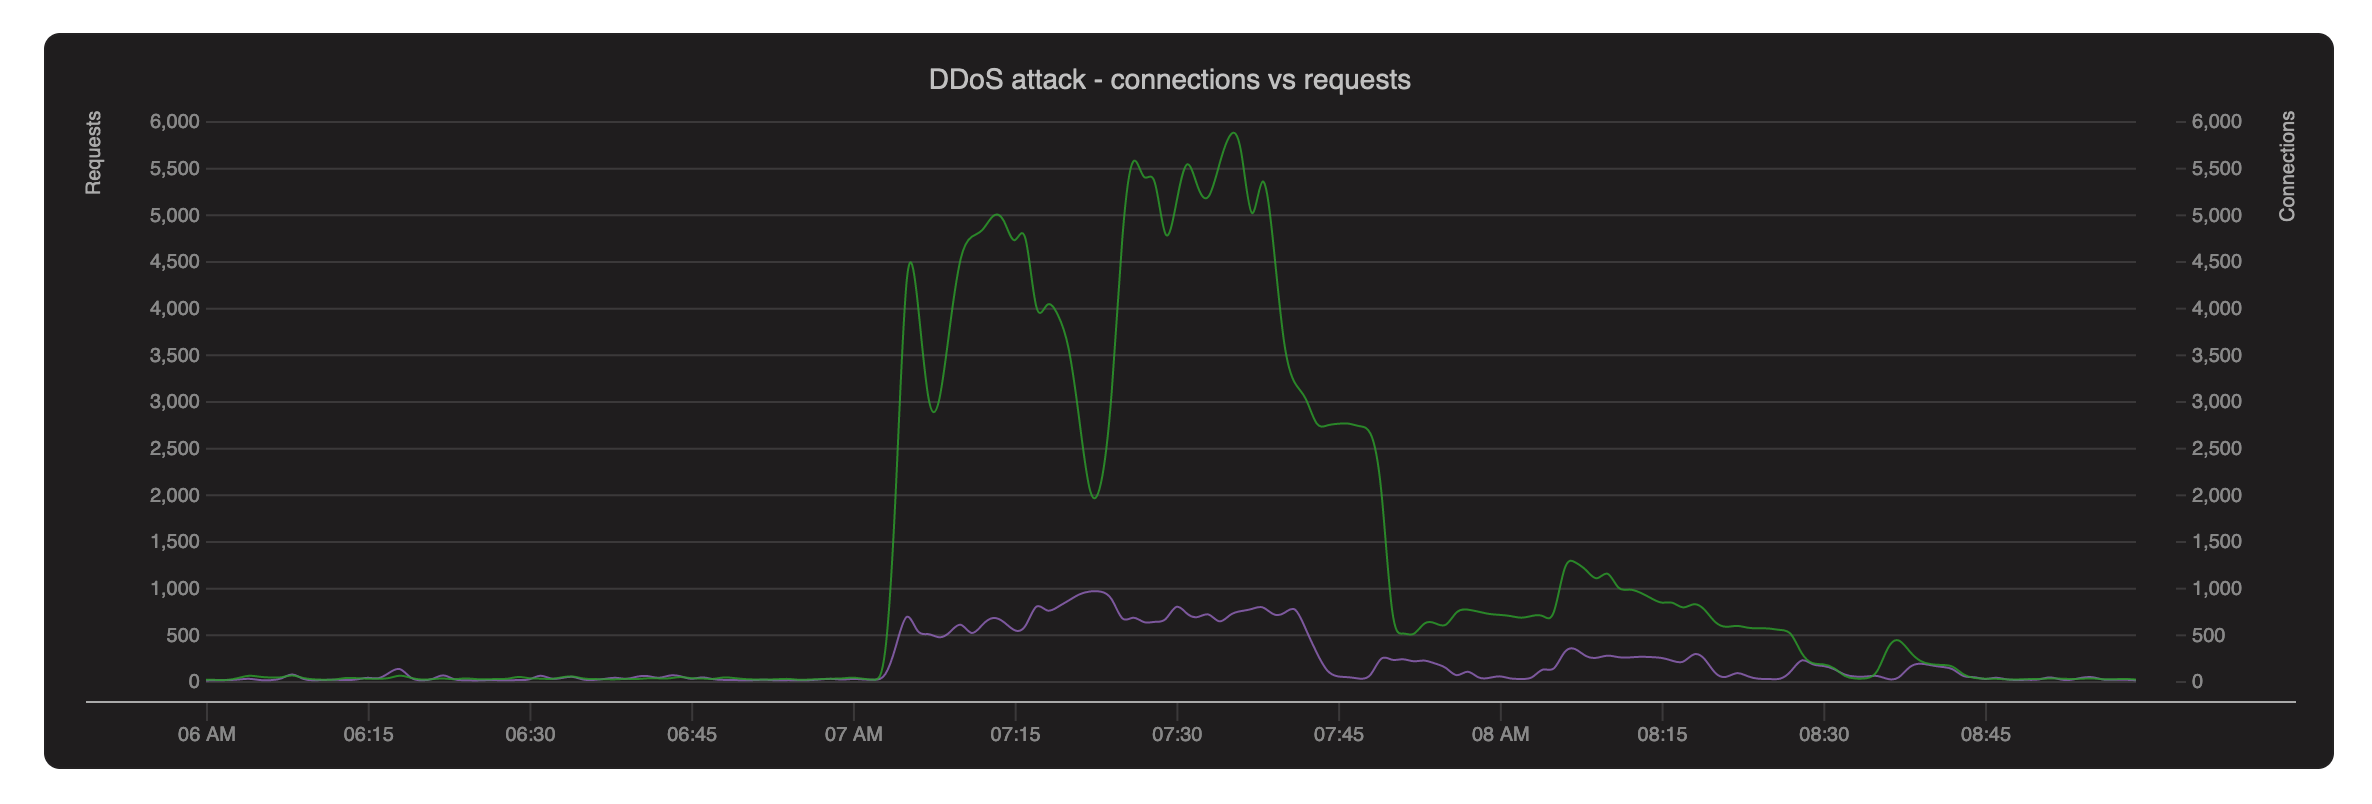
While this library is not actively maintained, it has extensive documentation with examples and comes with the following features;
- Declarative layout of charts using JSX
- Composition into multiple axes and multiple rows and overlays
- Interactivity, including pan and zoom, selection, and highlighting
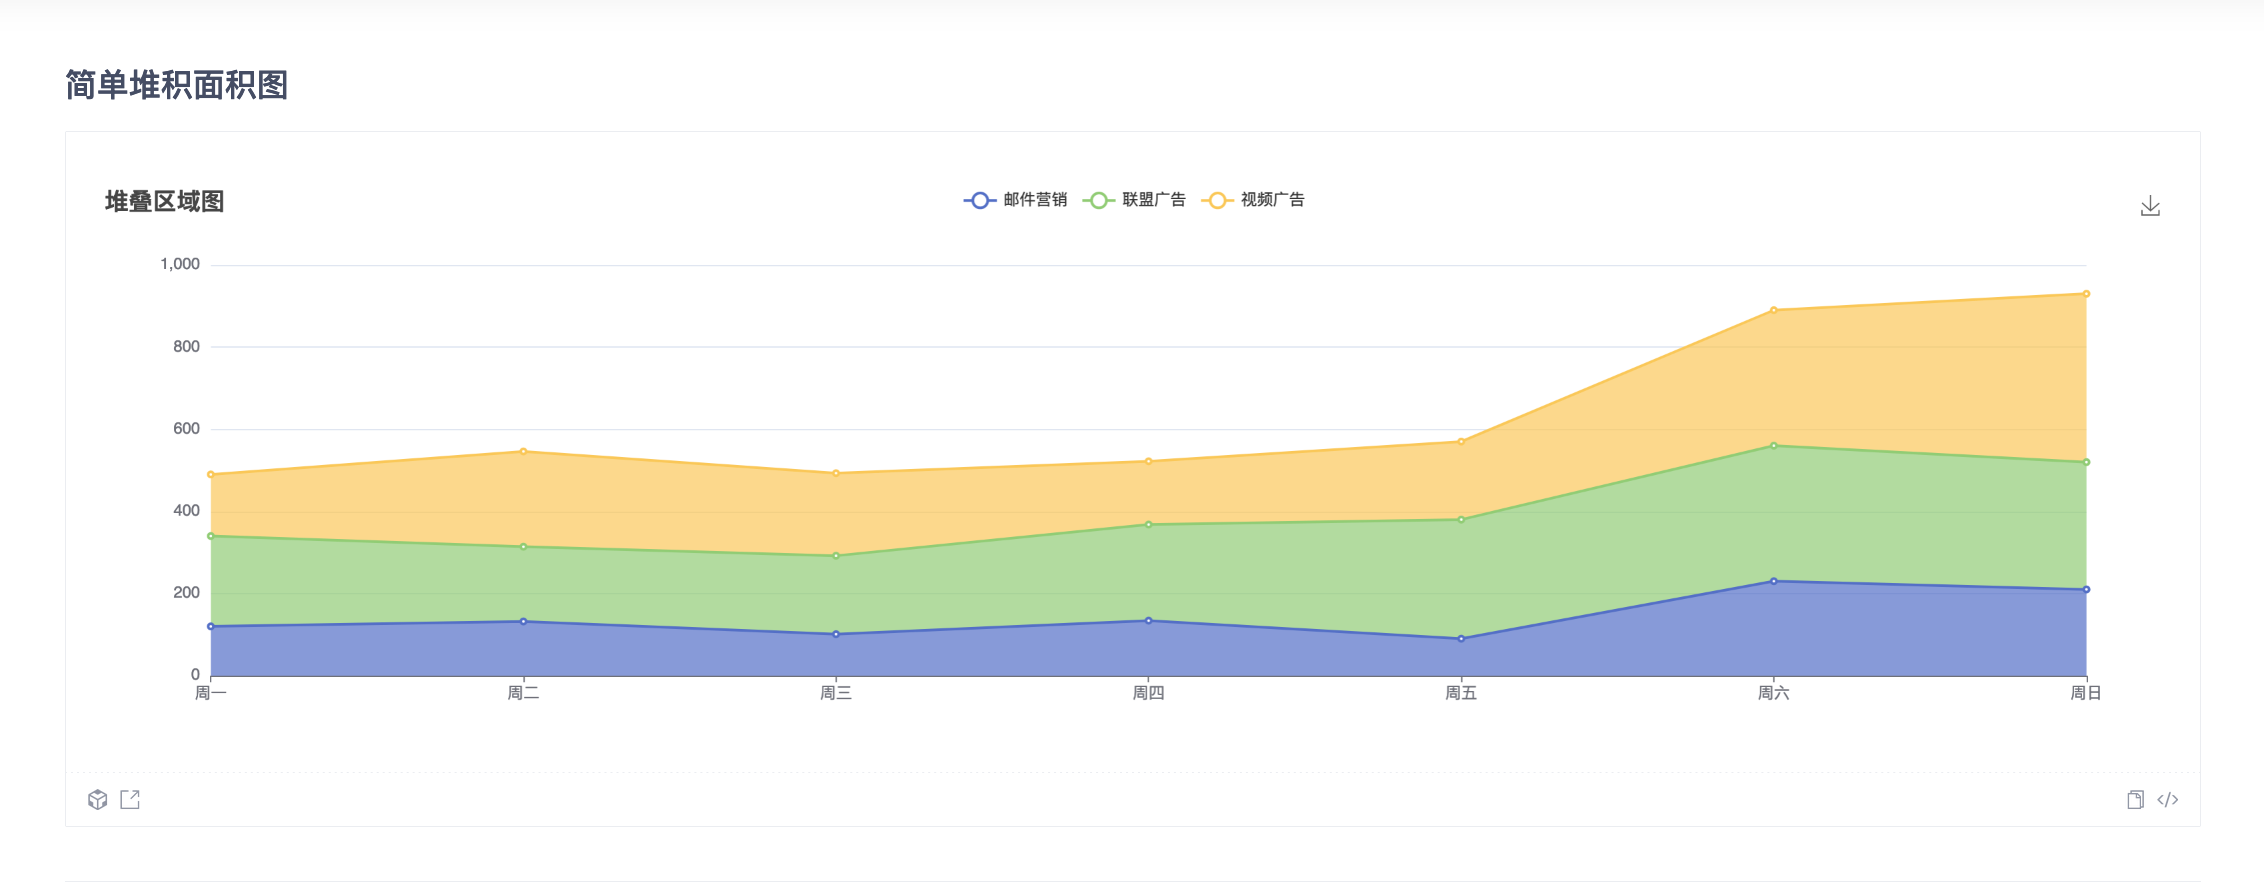
BizCharts
BizCharts is one of the top chart libraries for react. It is built by Alibaba. This library comes with a massive collection of charts for applications based on G2 and React which makes it ideal for almost all requirements.
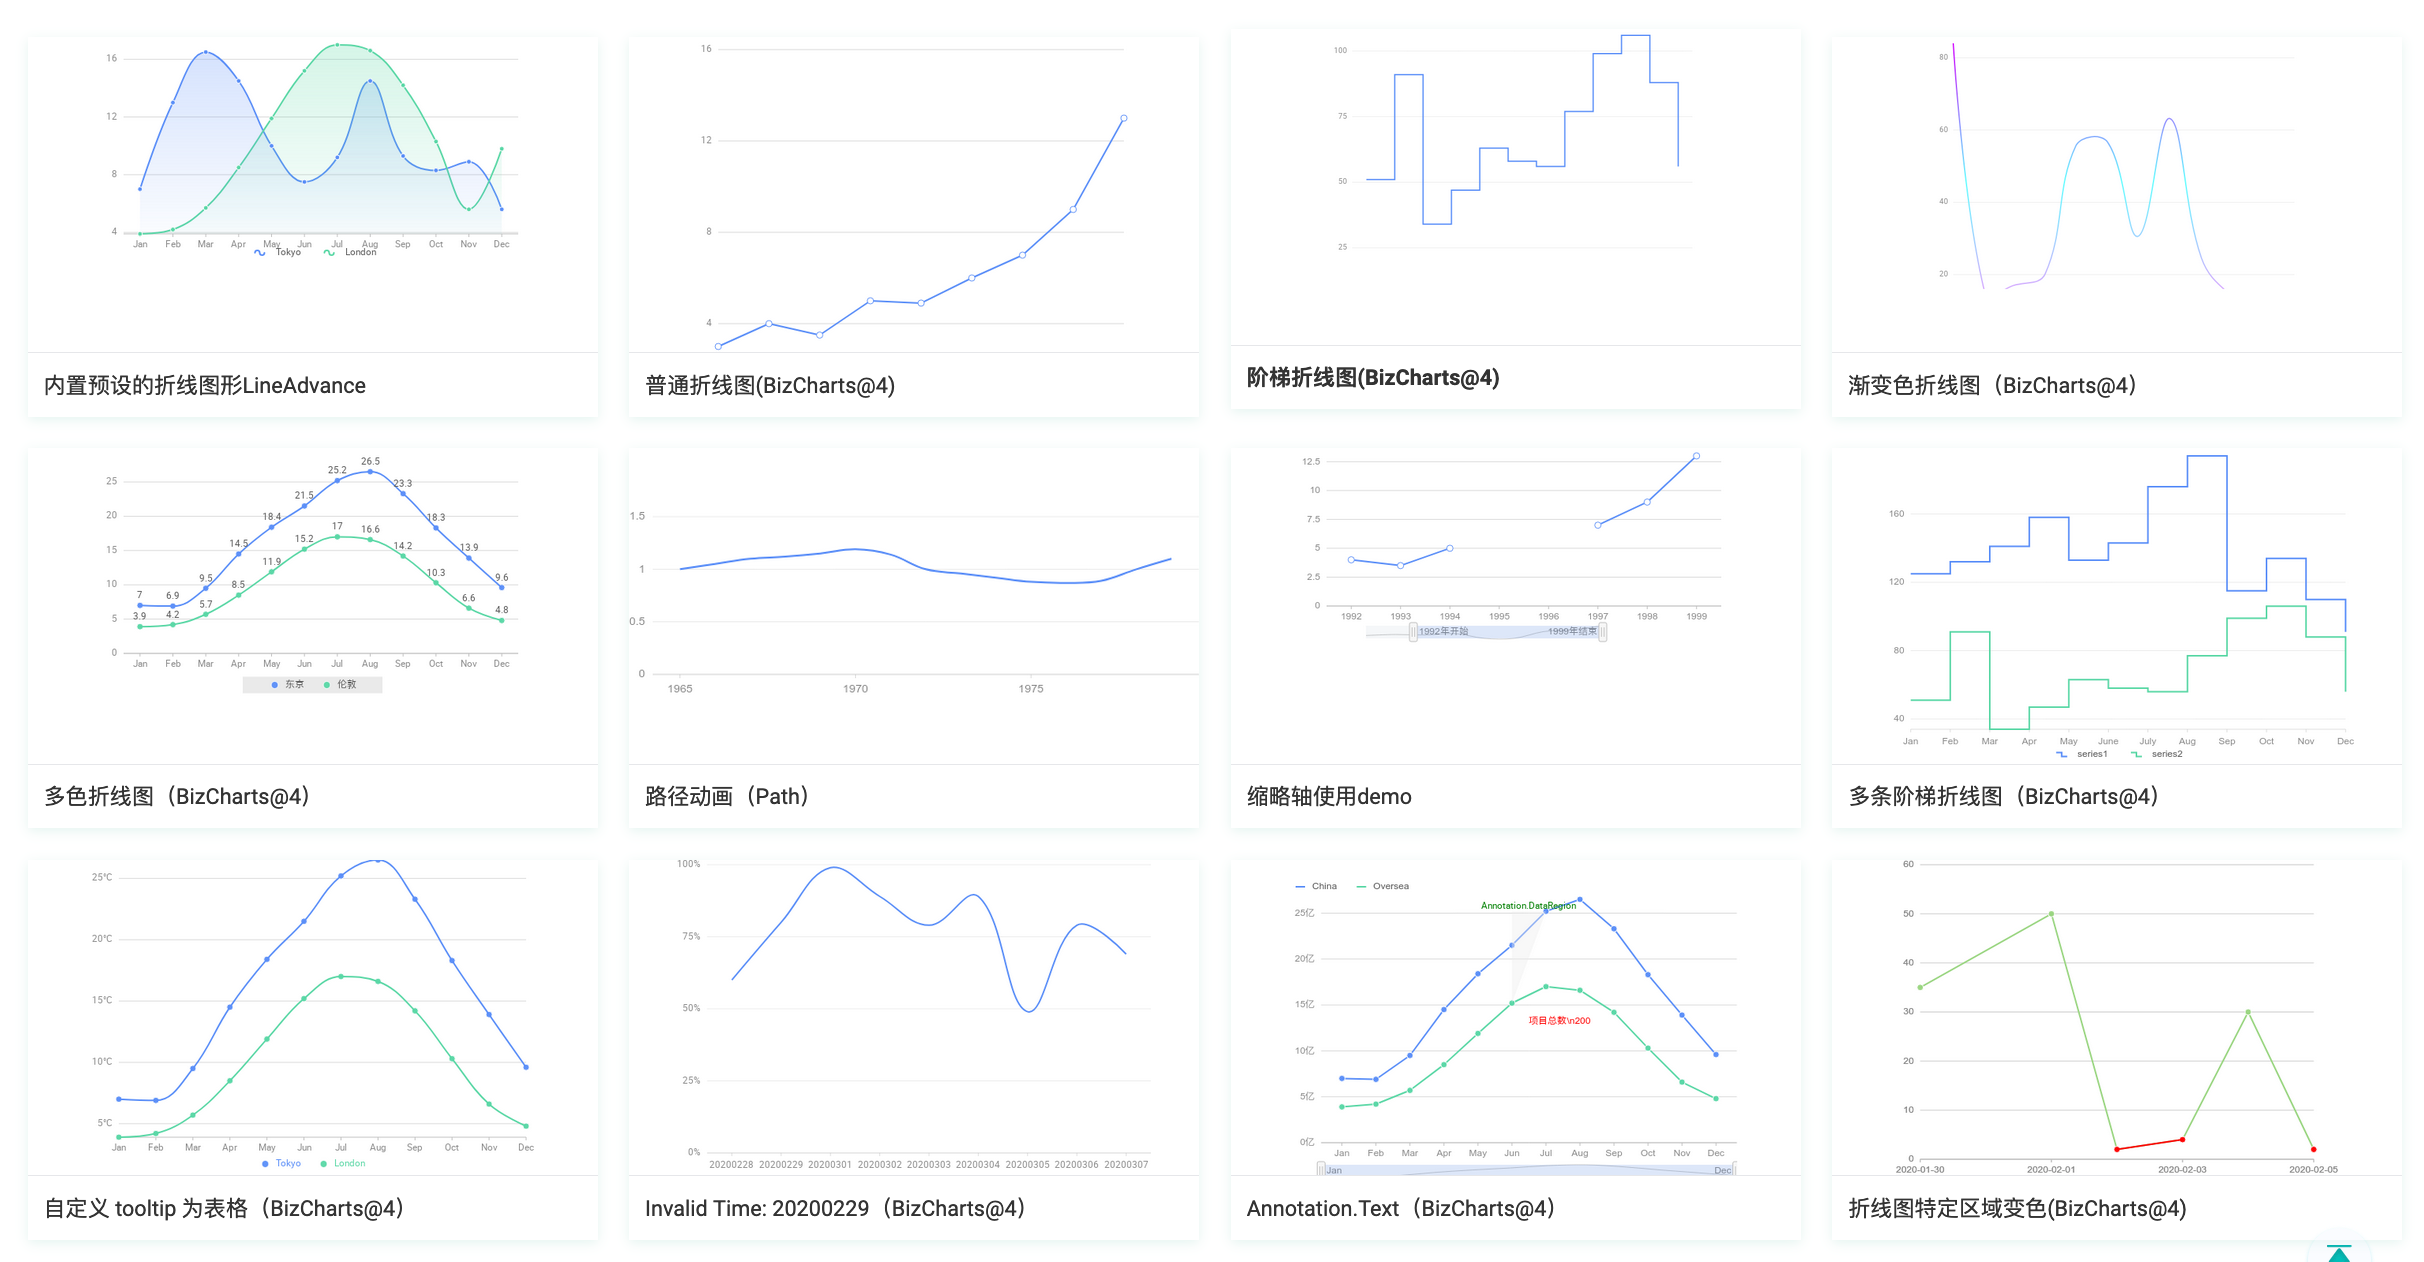
It has a small community of mostly Asians. It comes with the following features;
- Easy to use charting library
- Strong expansion potential
- Support for most data visualization charts
- React ES6 grammar
Visx
Visx is a React chart library by Airbnb which gained a lot of popularity in the market for taking advantage of the React DOM and combining it with D3.js.
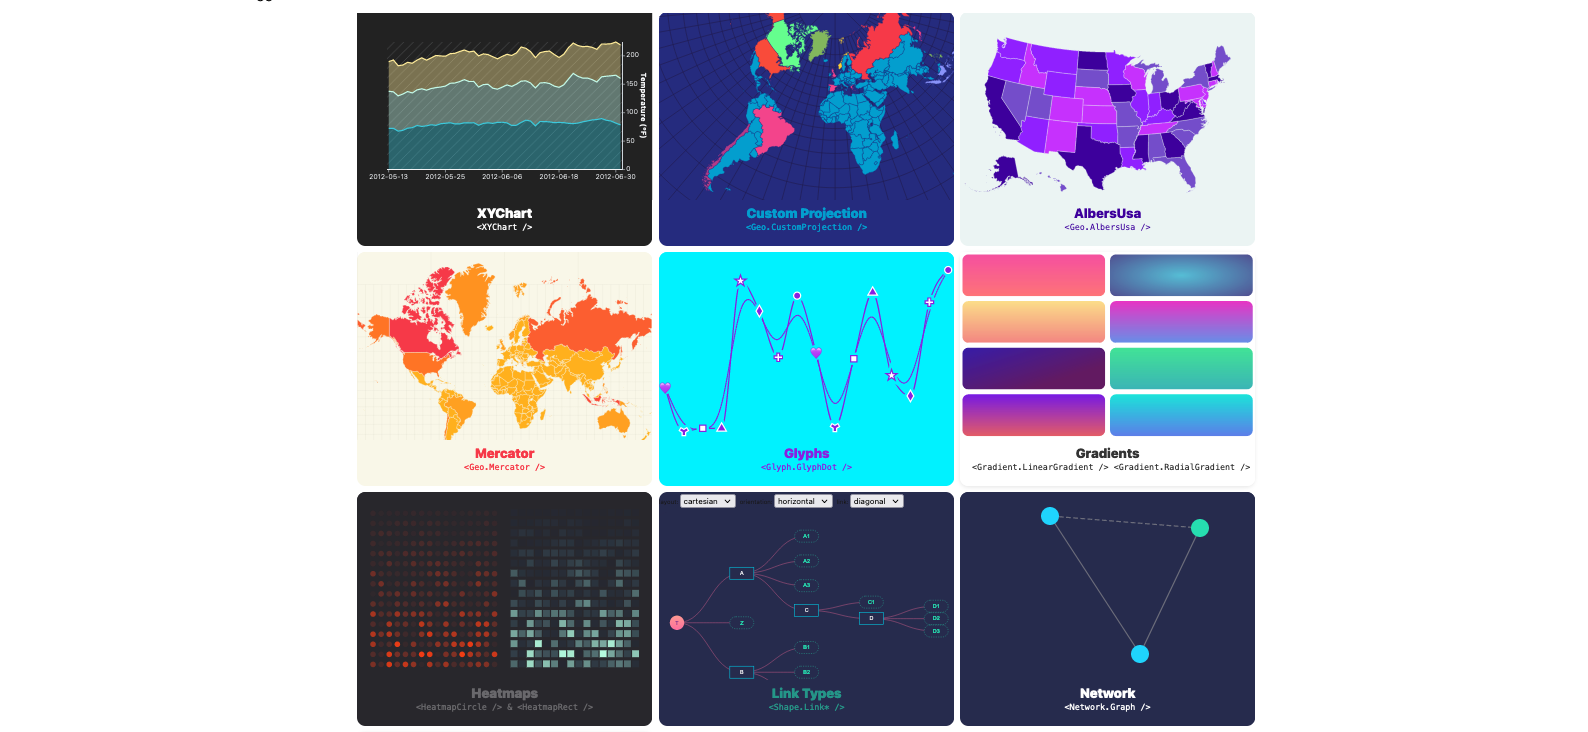
This library is an un-opinionated collection of reusable low-level visualization components. Visx library comes with the following;
- Smaller Bundle Size
- Ability to create complex visualizations like Chord, Treemap, Dendrograms
- D3 that helps perform mathematical computations
React Stockcharts
React Stockcharts is a React chart library that offers extensive and versatile templates for stock charts. It has over 60 technical indicators and overlays which is suitable for visualizing financial data.
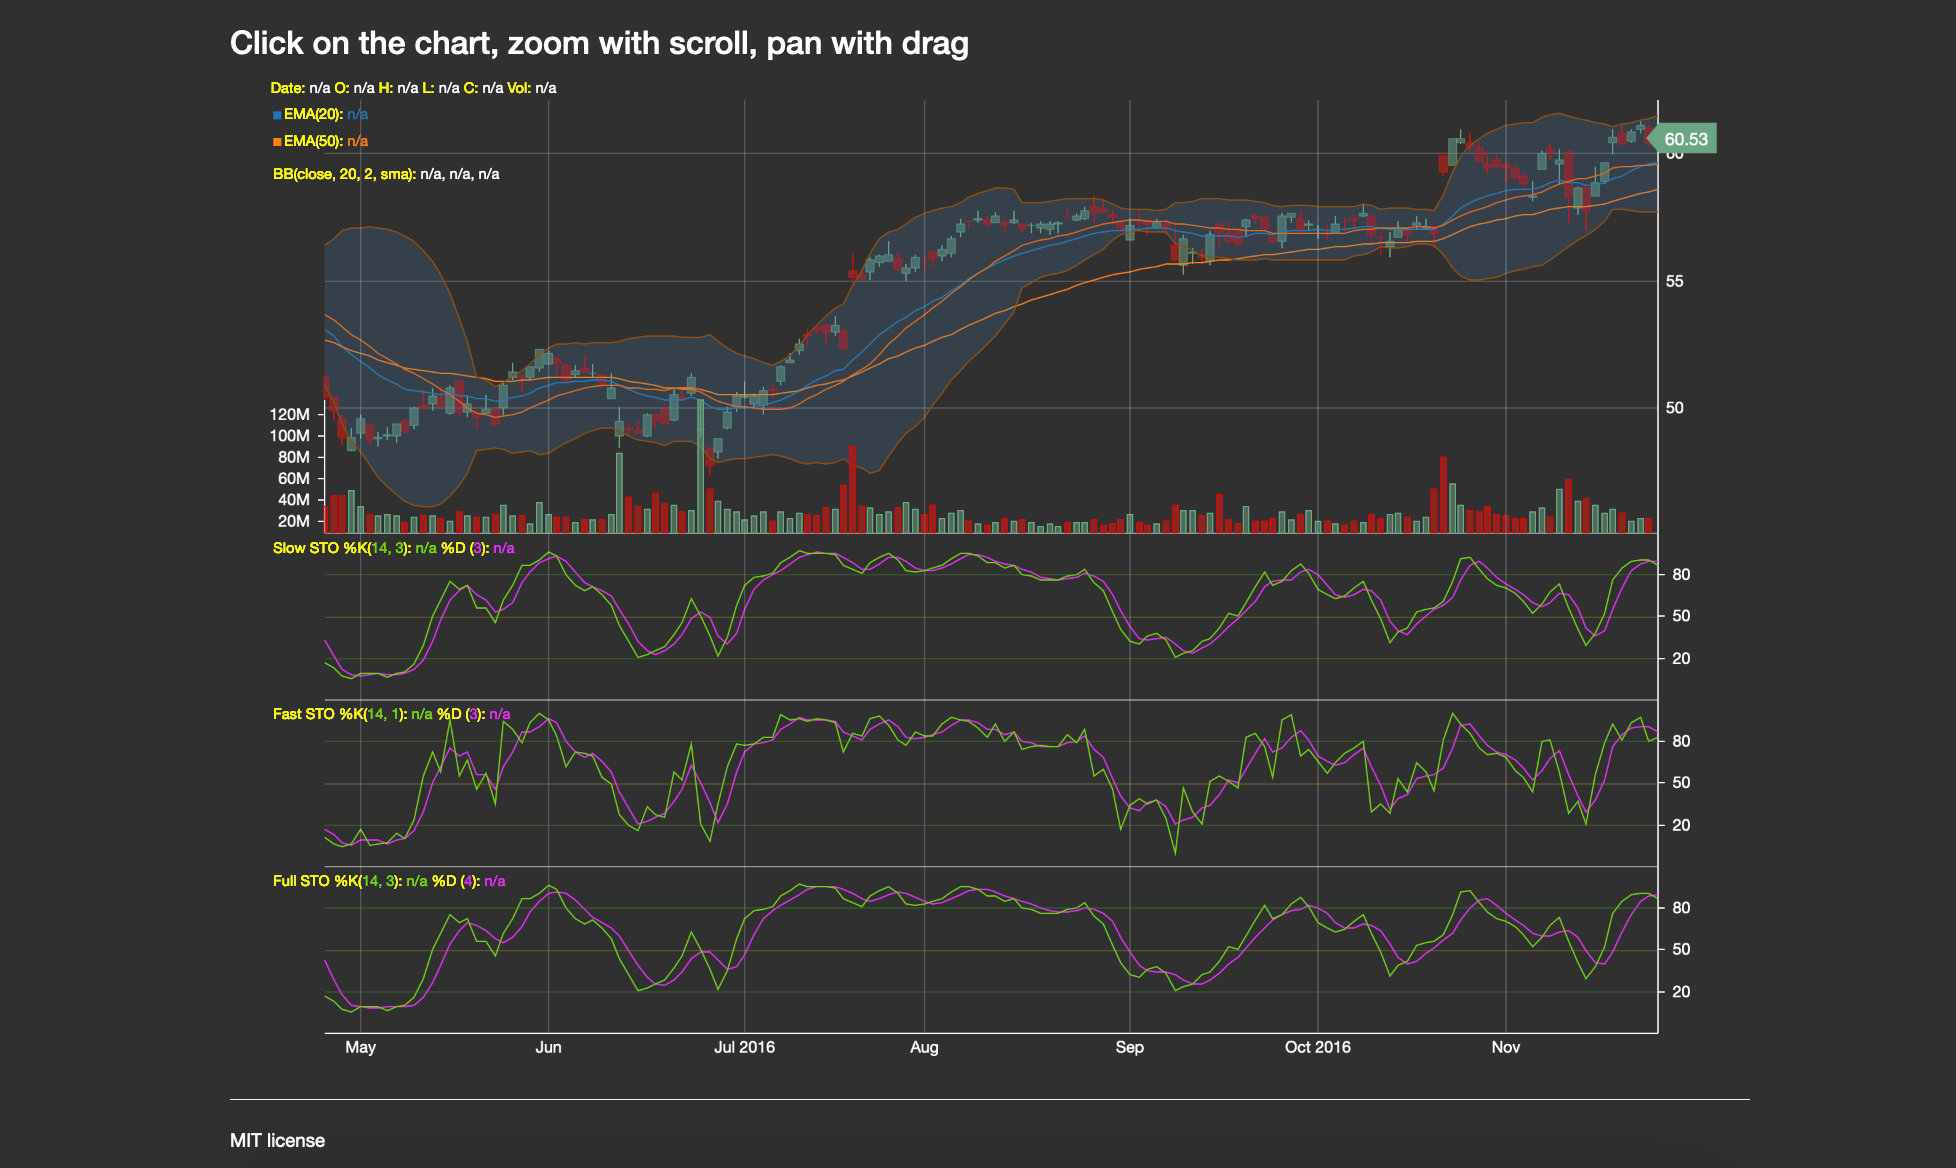
It is built with React and D3. This library has not been maintained for a very long time but it comes with the following features;
- Integration with multiple chart types
- Over 60 technical indicators and overlays
- Drawing objects
Ant Design Chart
Ant Design Charts is another popular React chart library that provides high-quality charts and focuses on the development experience and user experience in its default configurations.
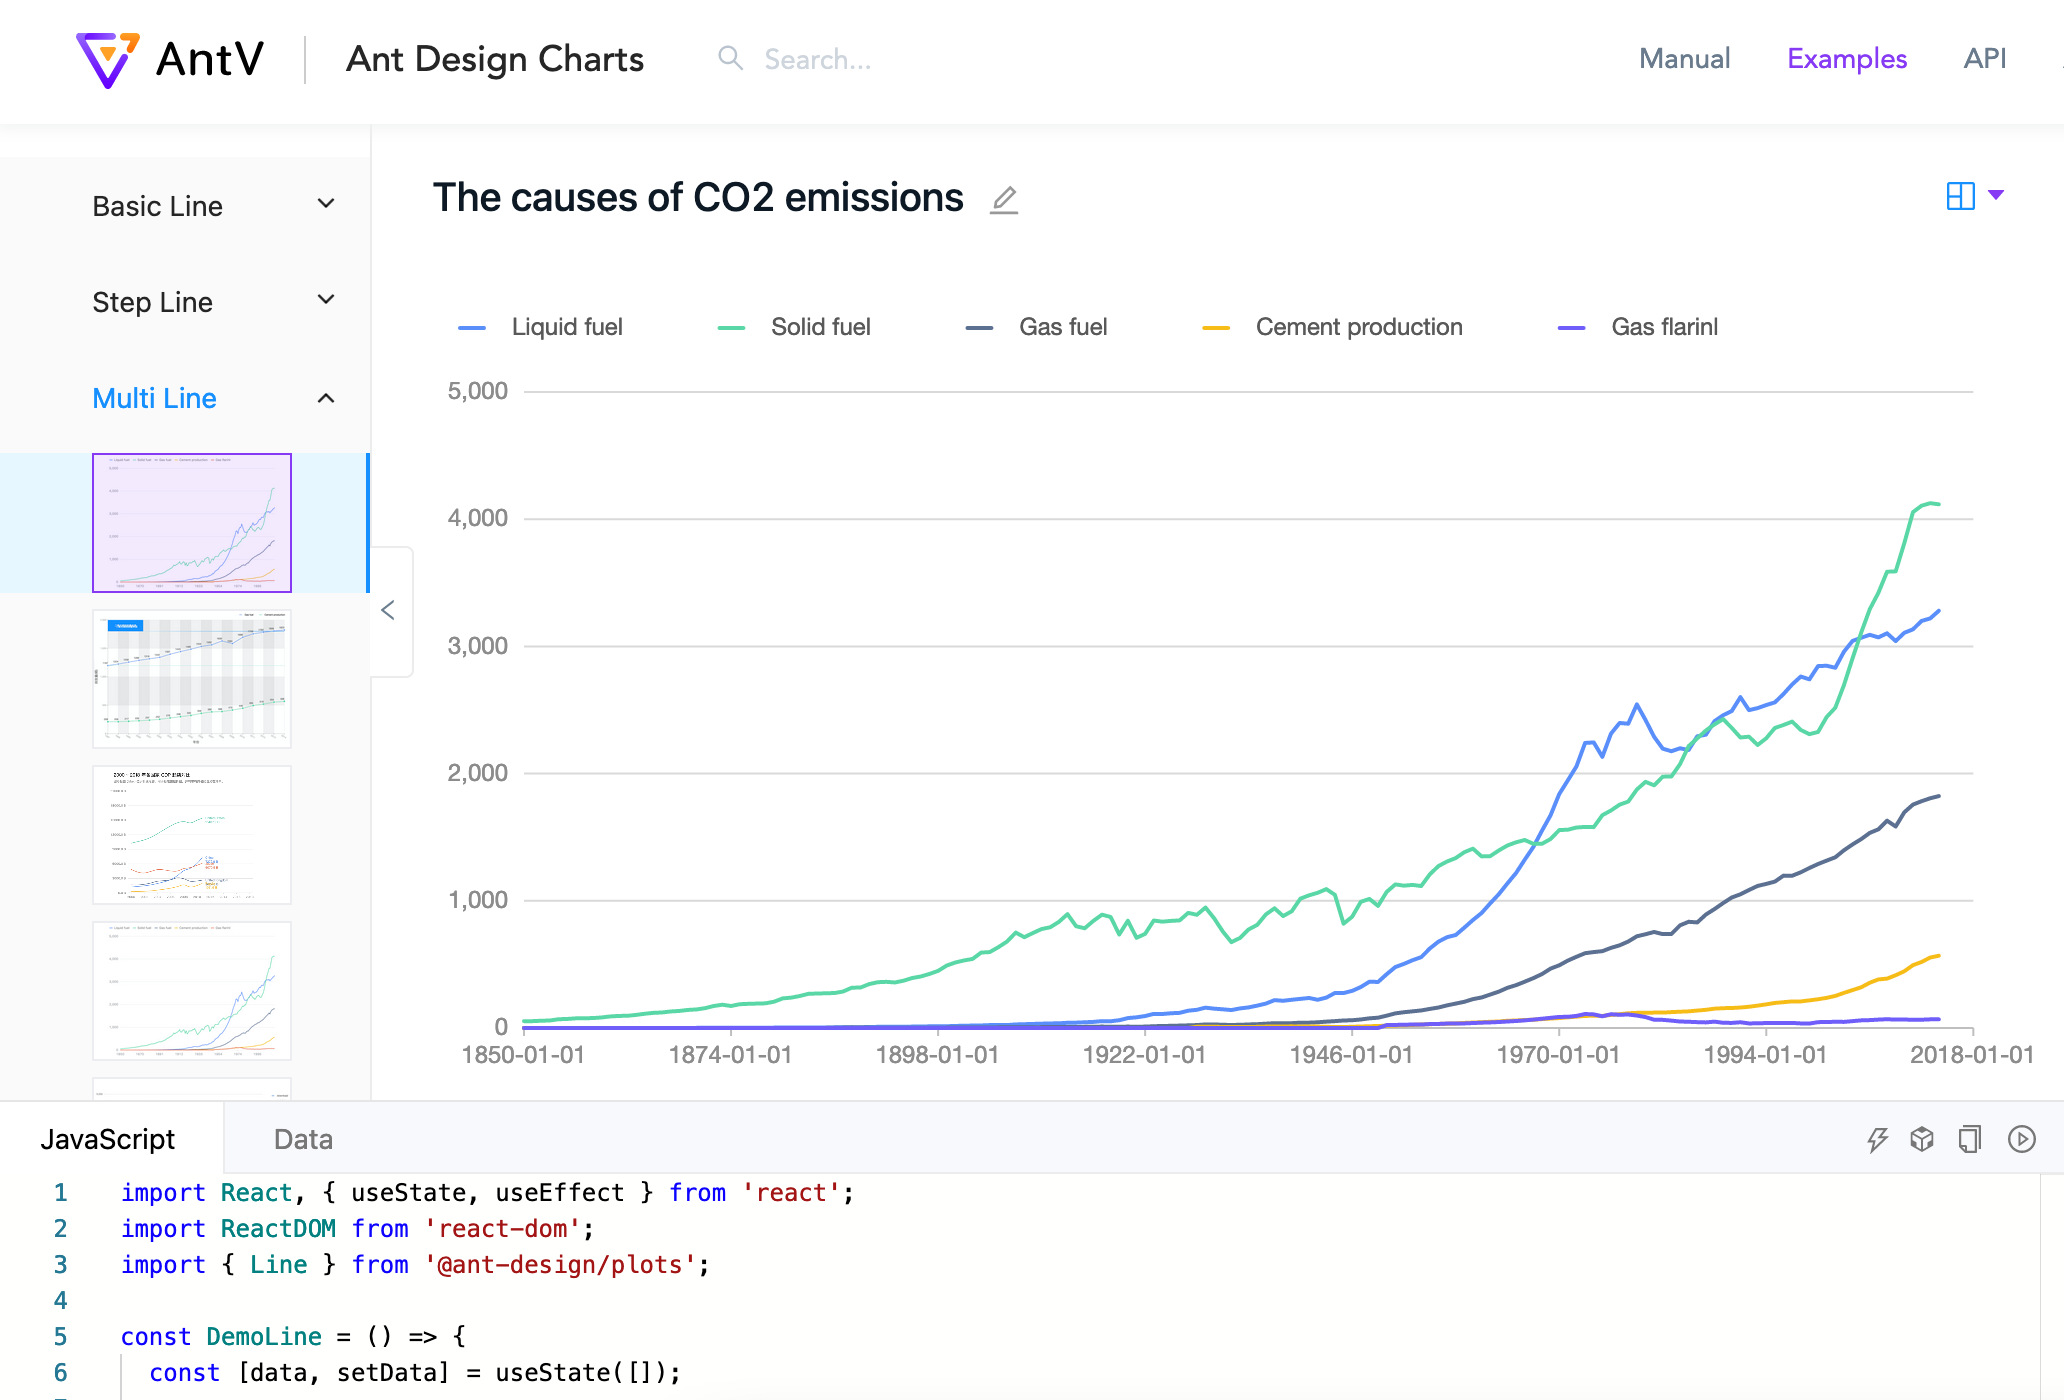
It is the React version of AntV, and it comes with the following features;
- Easy configuration
- Detailed and accurate data representation
- Optional customization options with ready-to-use default chart solutions
- Responsive charting solutions
eChart for React
eCharts for React is a powerful data visualization react chart library written in pure JavaScript and based on zrender.
It is one of the most intuitive and highly customizable react chart libraries with the following features;
- Multi-rendering support
- Cross-platform support
- Dynamic data and special effects
- Mobile Optimization
- Accessibility features
React-financial-charts
React-financial-charts is a React charting library that developers also use for data visualization in any React app.
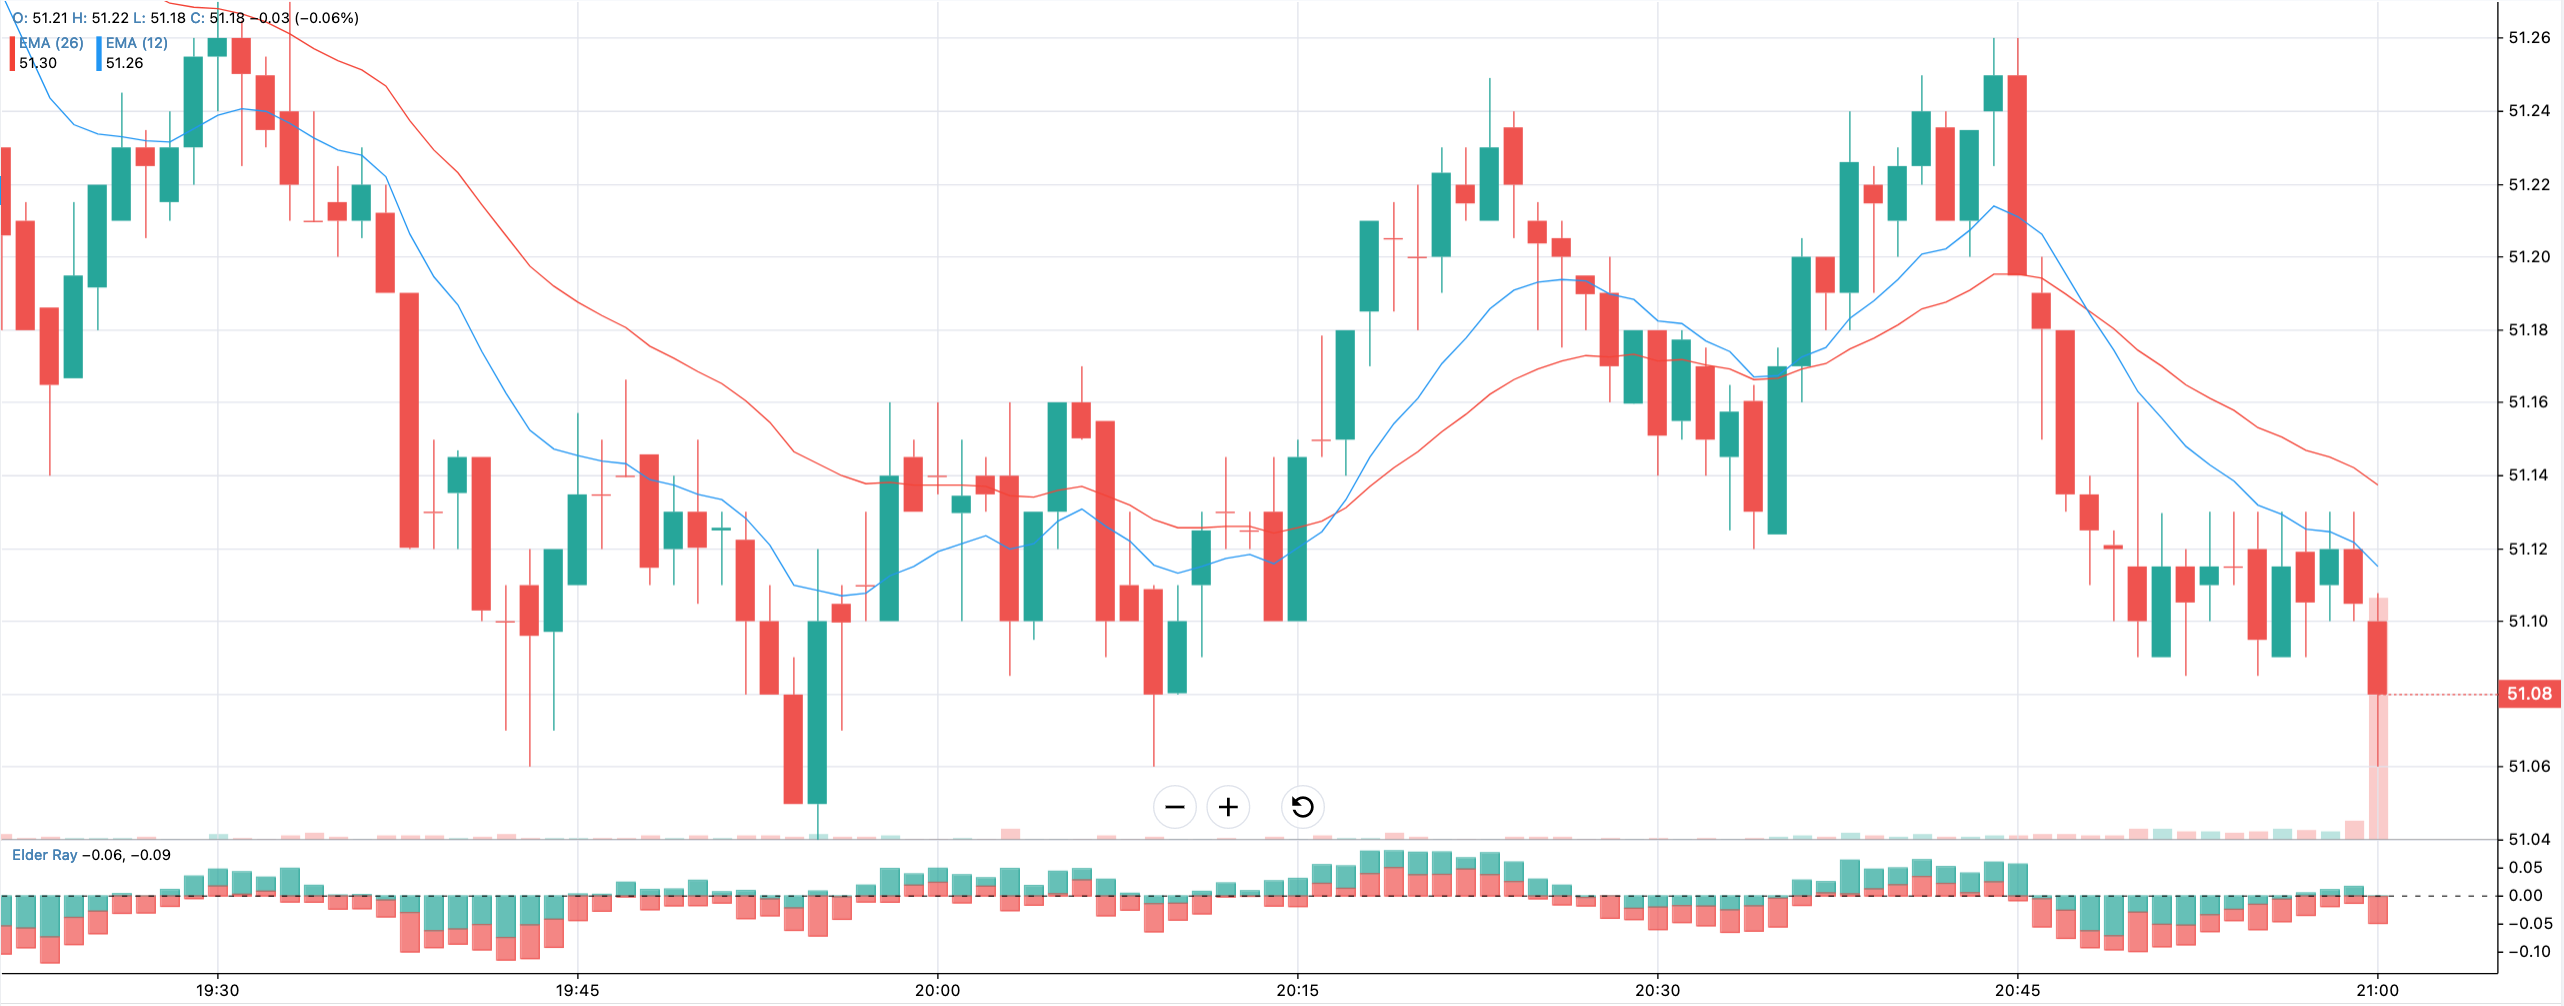
This library was built on top of React stock charts with typescript syntax since React stock charts is no longer maintained. This library comes with the following features;
- integrates multiple chart types
- over 60 technical indicators and overlays
- drawing objects
This chart library has over 8 chart types and over 14 indicators stock data visualization needs in any React web app.
Rumble-charts
Rumble-charts is another D3.js-based chart library for React that can also be used for data visualization. The creators of this library describe it as React components for building composable and flexible charts.
This data visualization library comes with the following features;
- Based on D3.js under the hood
- Built-in functionality to use labels
- Composable
- Flexible
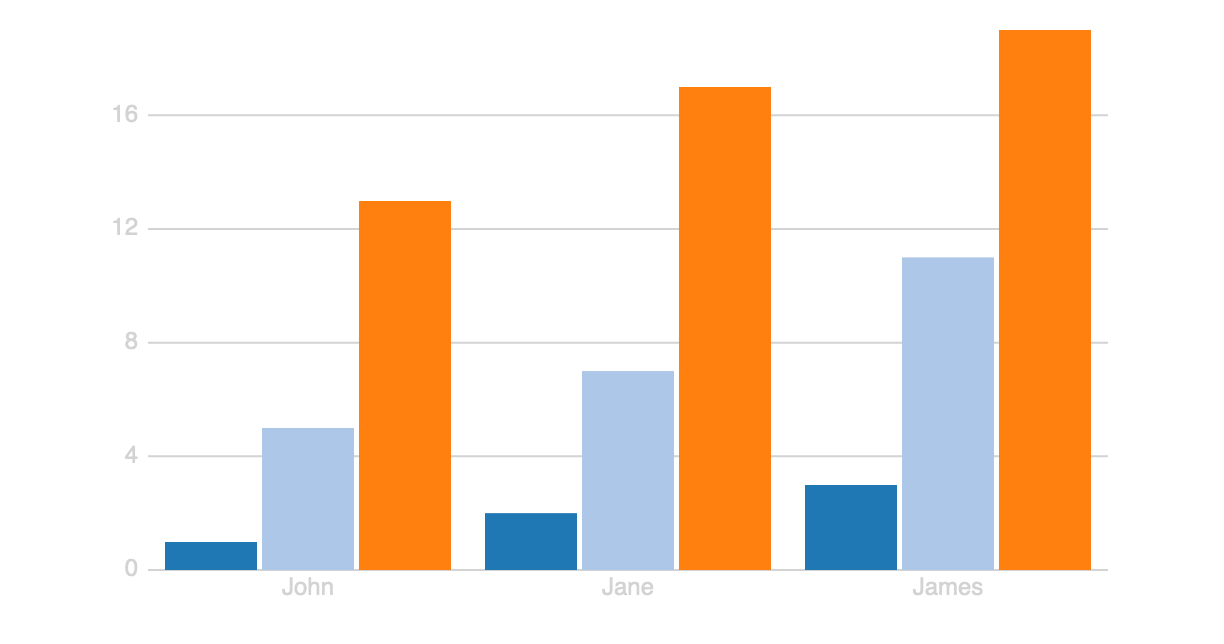
C3.js
C3.js is a data visualization library that is also based on D3.js for React. It enables deeper integration of charts in web applications. This library gives developers the flexibility to create reusable charts, and also manipulate the charts after they appear on the screen.
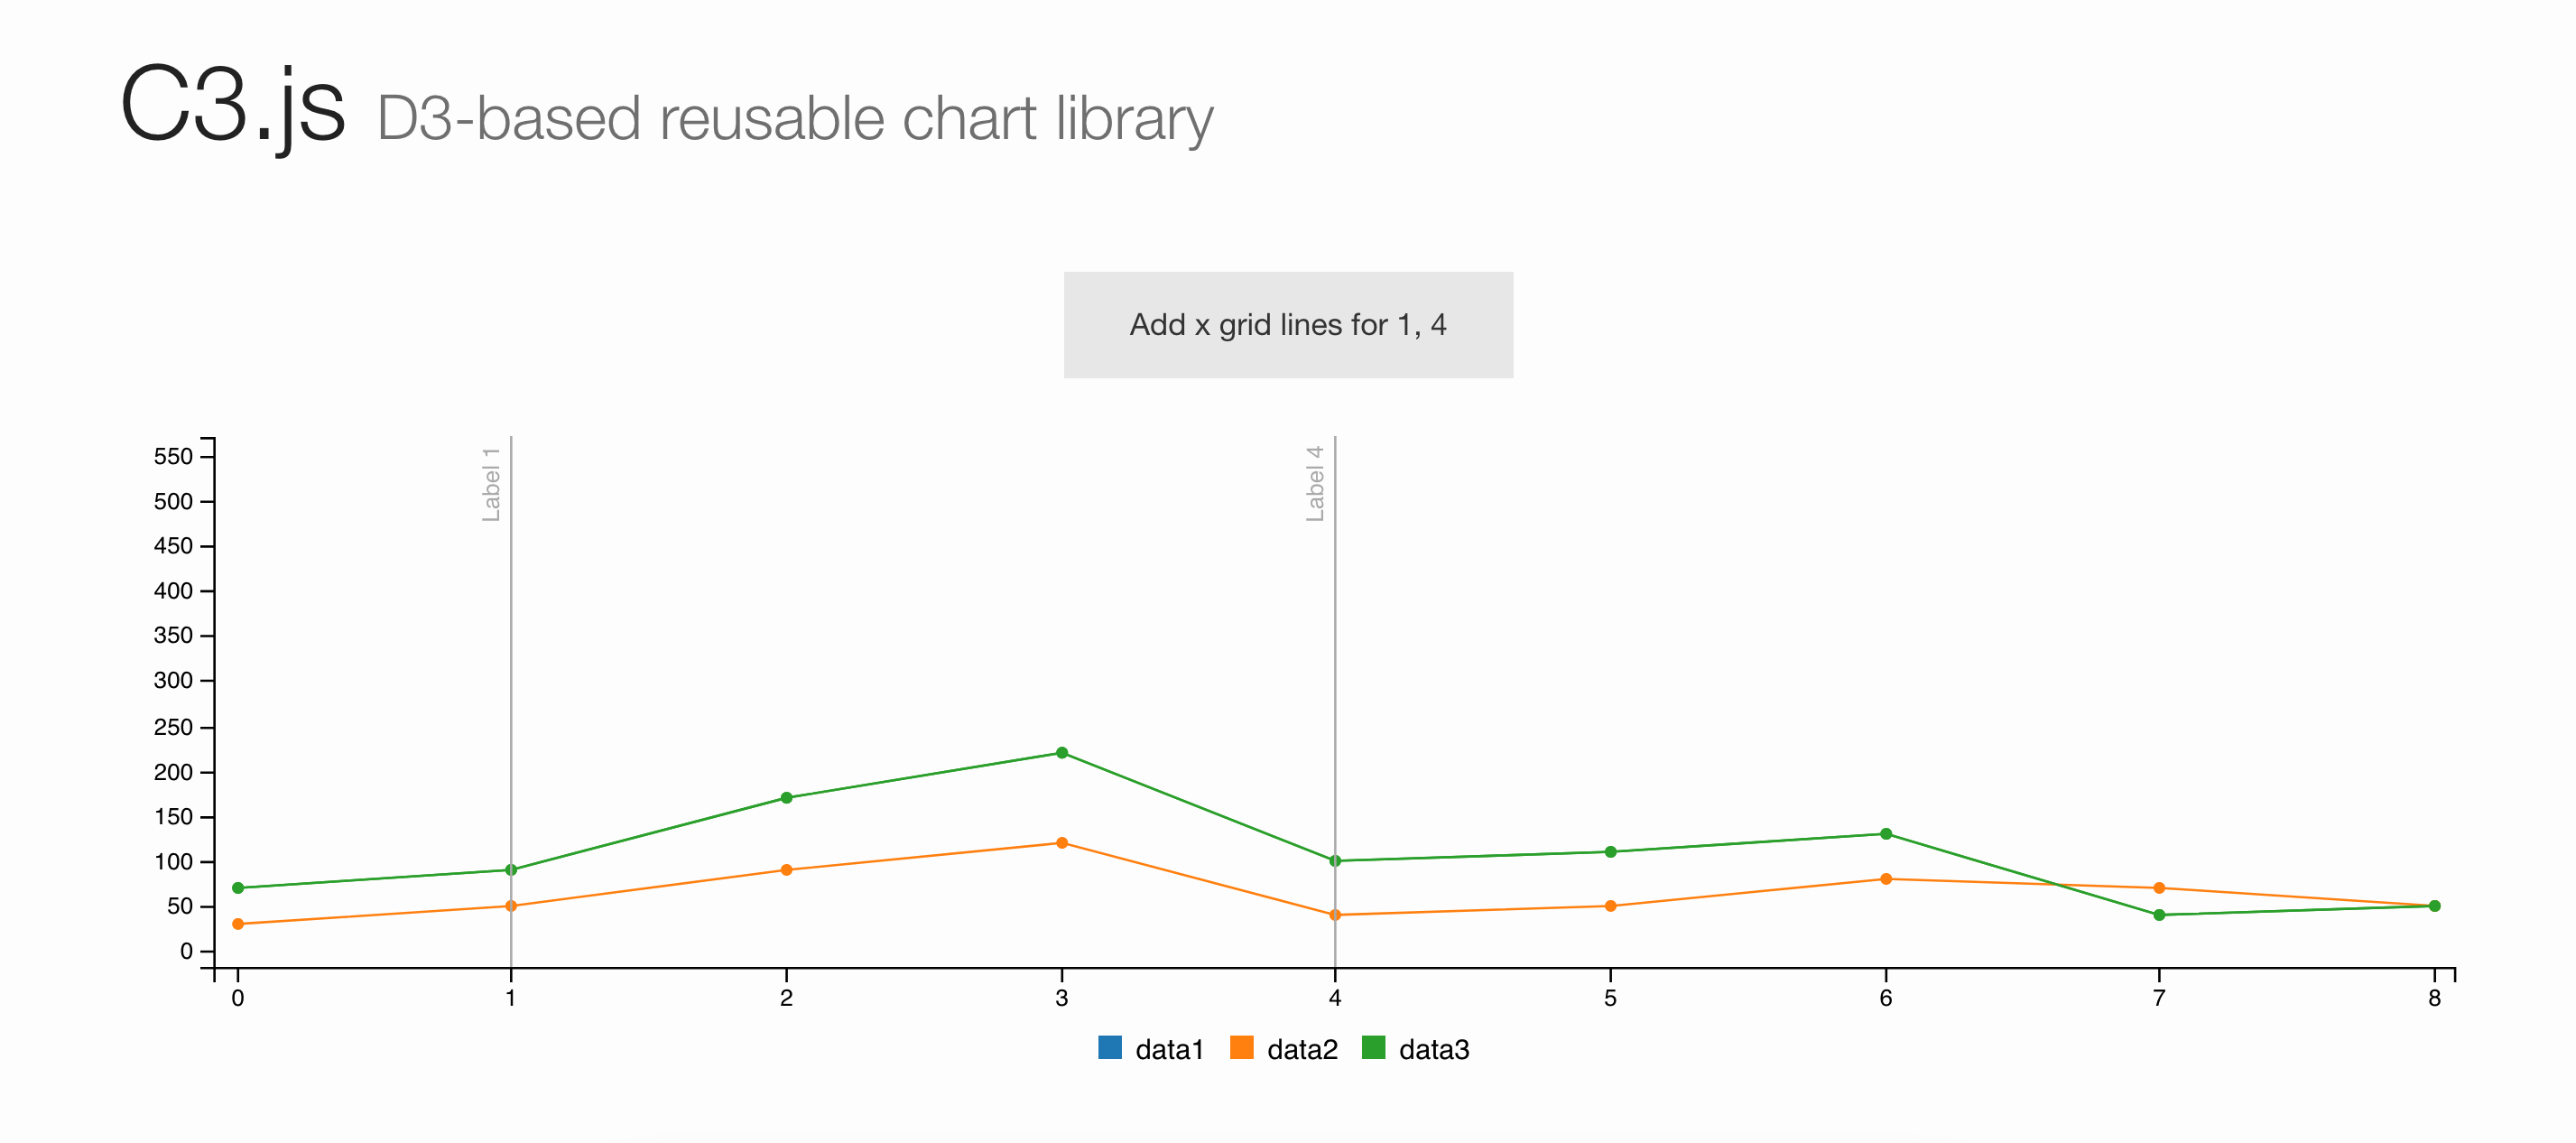
This library has the following features;
- C3 allows you to wrap the code required to construct an entire chart which generates a D3-based chart without having to any D3 code.
- C3 also gives the flexibility of defining a custom style by class.
- C3 charts can also be updated after rendering because of the variety of APIs and callbacks which gives you access to the chart’s state.
Canvas.js
CanvasJS is an easy-to-use HTML5 and Javascript charting library that works with the most popular technologies and frameworks like React, Angular, jQuery, and even server-side technologies like PHP.
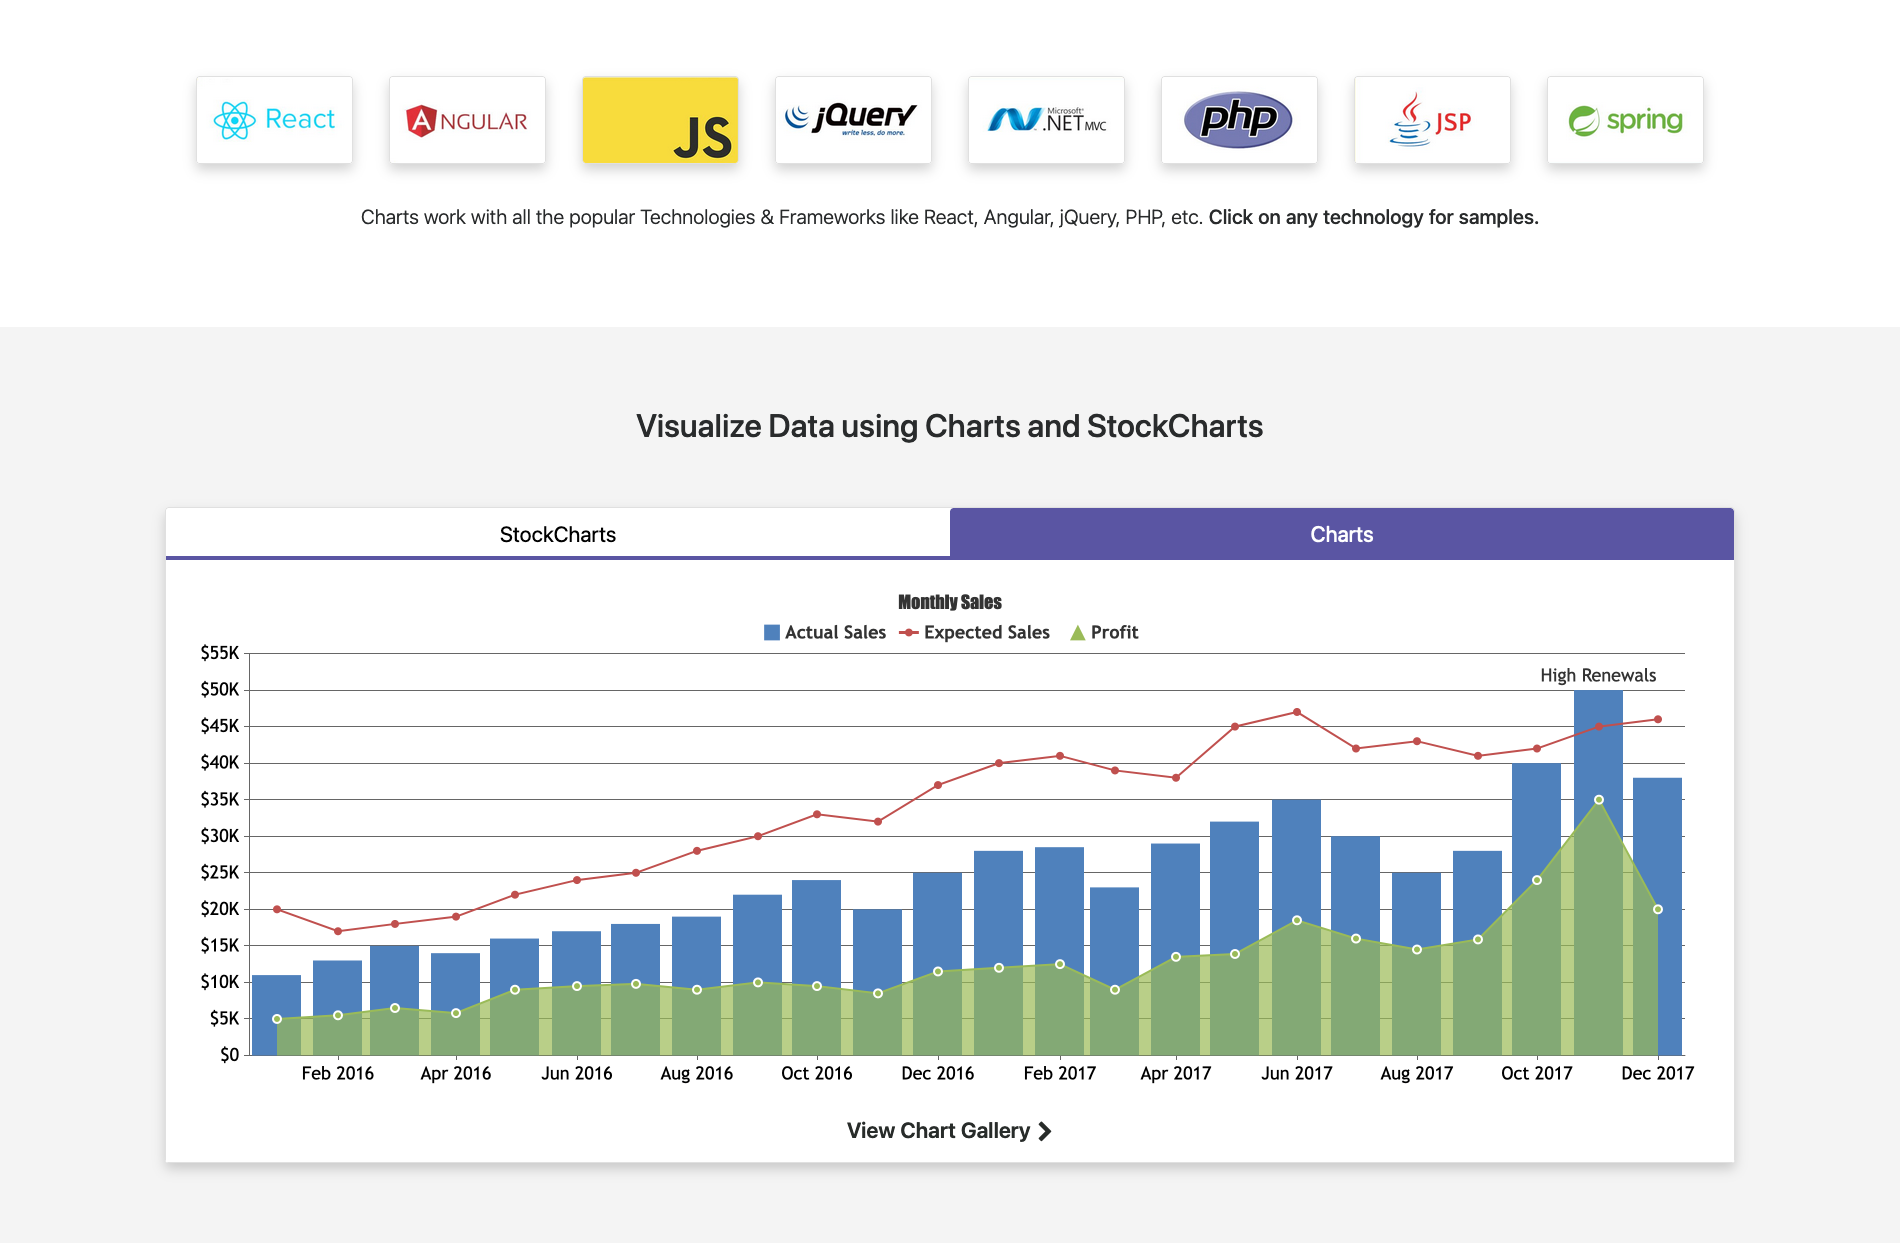
It runs across devices including iPhone, iPad, Android, Microsoft Surface, Desktops, etc. which makes it easier to create rich responsive dashboards that can work across devices without compromising on maintainability or functionality.
Chartist.js
Chartist.js is a simple, flexible way to visualize so many types of data. From your standard line charts, donut charts, and bar charts to animated and responsive charts that are highly customizable to meet your needs.
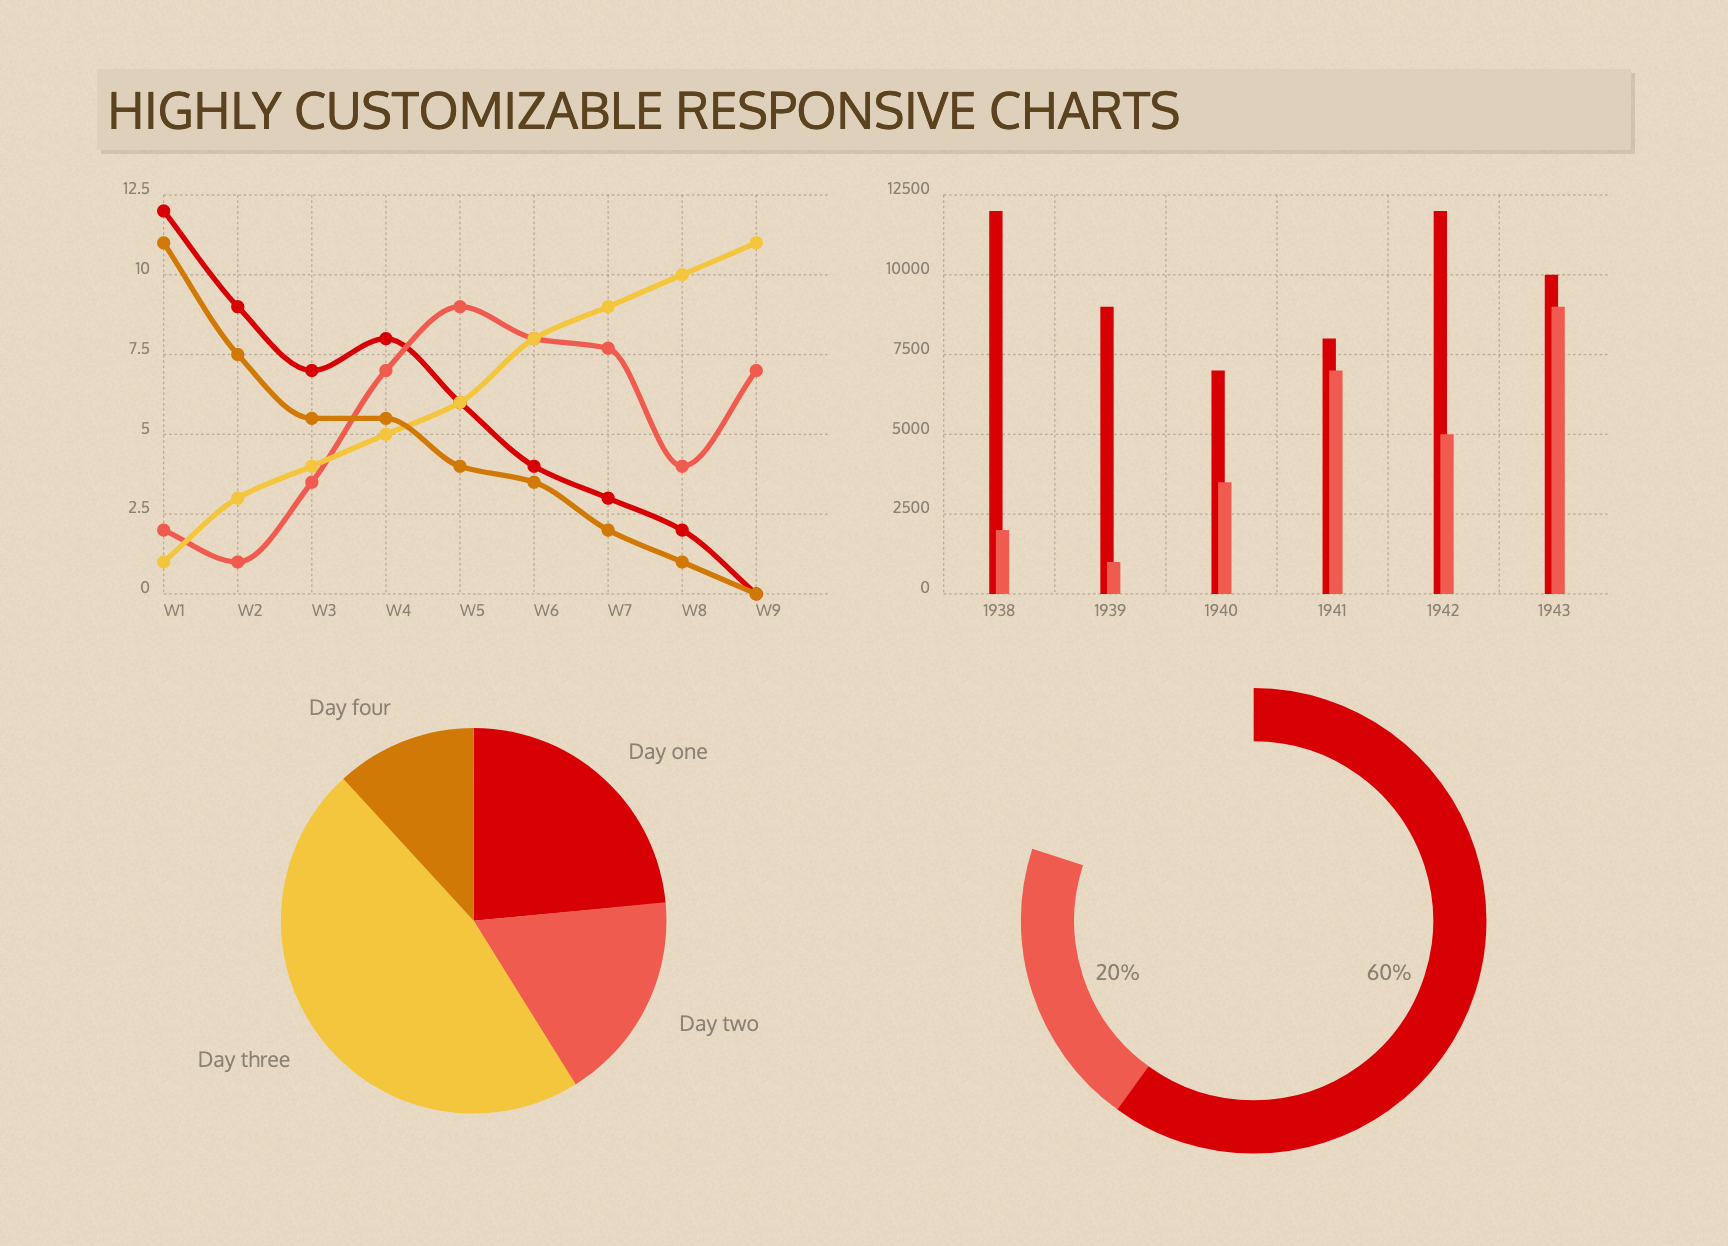
It’s lightweight with minimal dependencies which makes it easy to port into whatever application you need it for.
Cubism.js
Cubism.js is a D3 plugin for visualizing time series. It scales in terms of perception: small multiples that are aligned by time facilitate rapid comparison.
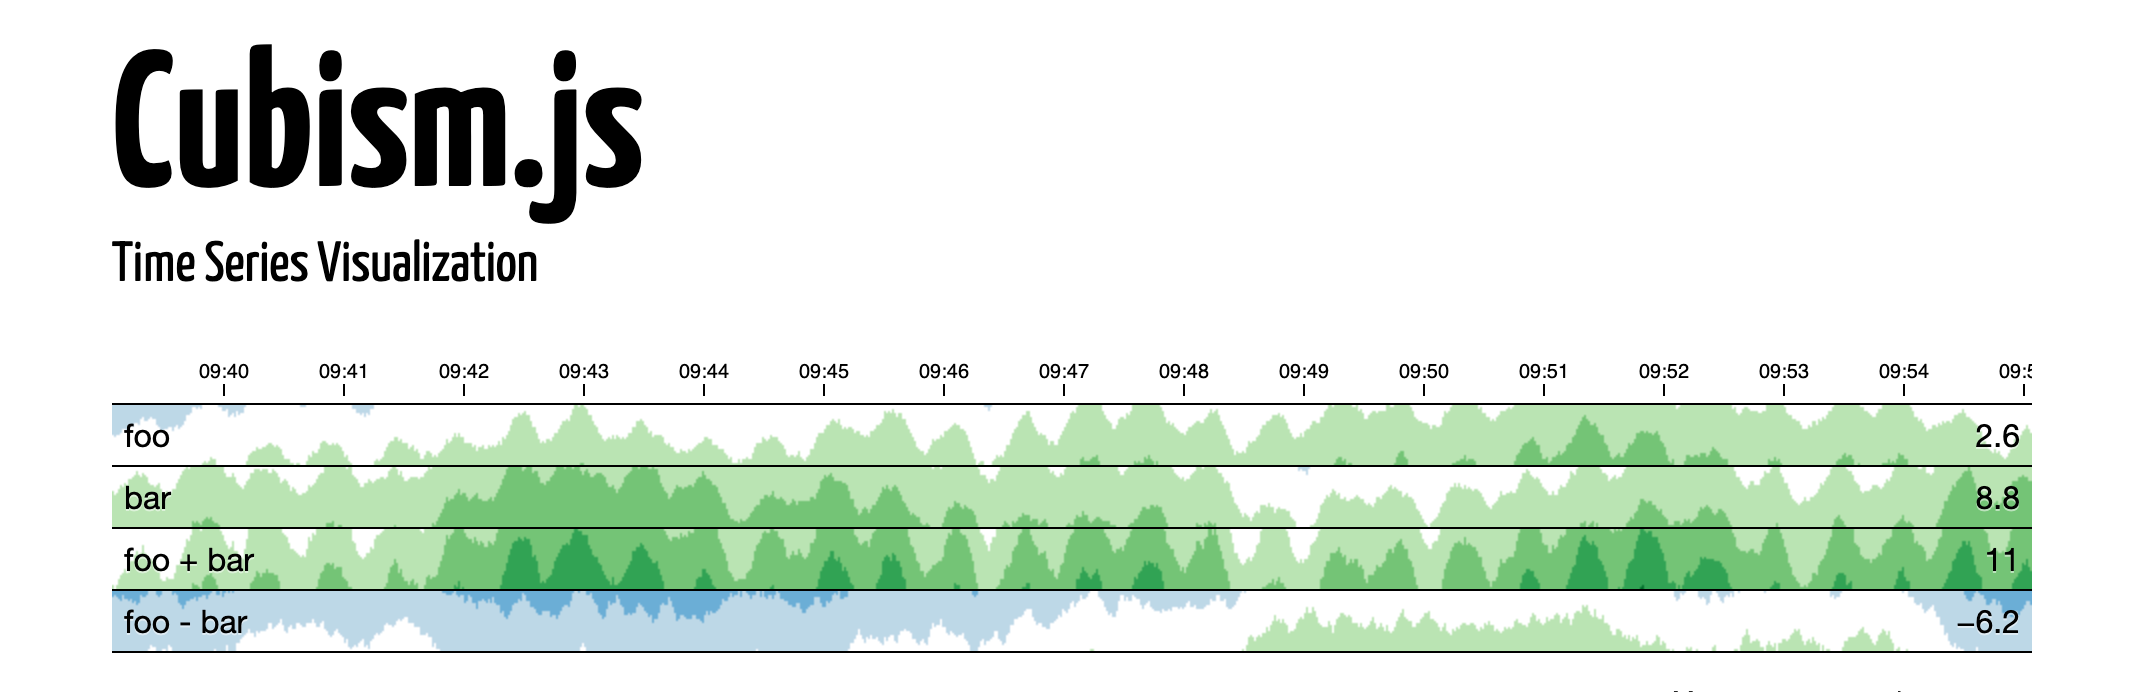
This library can be used to;
- construct better real-time dashboards.
- pull data from graphite, cube, and other sources.
Other Chart Libraries
Here’s a list of more chart libraries to explore when working on any React application:
- Cytoscape.js
- ApexChart.js
- D3.js
- Dygraphs
- FusionCharts
- Google Charts
- Highcharts
- JSCharting
- Morris.js
- n3-charts
- NVD3
- Plottable.js
- Rickshaw
- ZingChart
Recommended Resources
Finally, we’re at the end of the article but there’s always more to learn, so if you’d like to learn more on how to use some of these chart libraries in your React application. I’d recommend you also look up the resources below:
Interesting Reads From Our Blogs
- React Calendar: How to Build a Reusable Calendar Component
- React useState Hook
- How to Convert Figma to React
- Understanding React Portal
- Your Guide to React Context API
Conclusion
There are far too many charting libraries for React to cover in a single article, but the charting libraries listed above are free and open-source libraries that can be used in any web or mobile application.
It is important to know that these charting libraries were all built to help developers in achieving a certain end result. When deciding on which one to use, examine their features and functions before picking which is best suited for your project.
Some of these chart libraries are better suited to smaller projects, while others are better suited for larger projects. But in the end, your project’s requirements and the features needed in the project would determine which React chart libraries are well suited for the project.
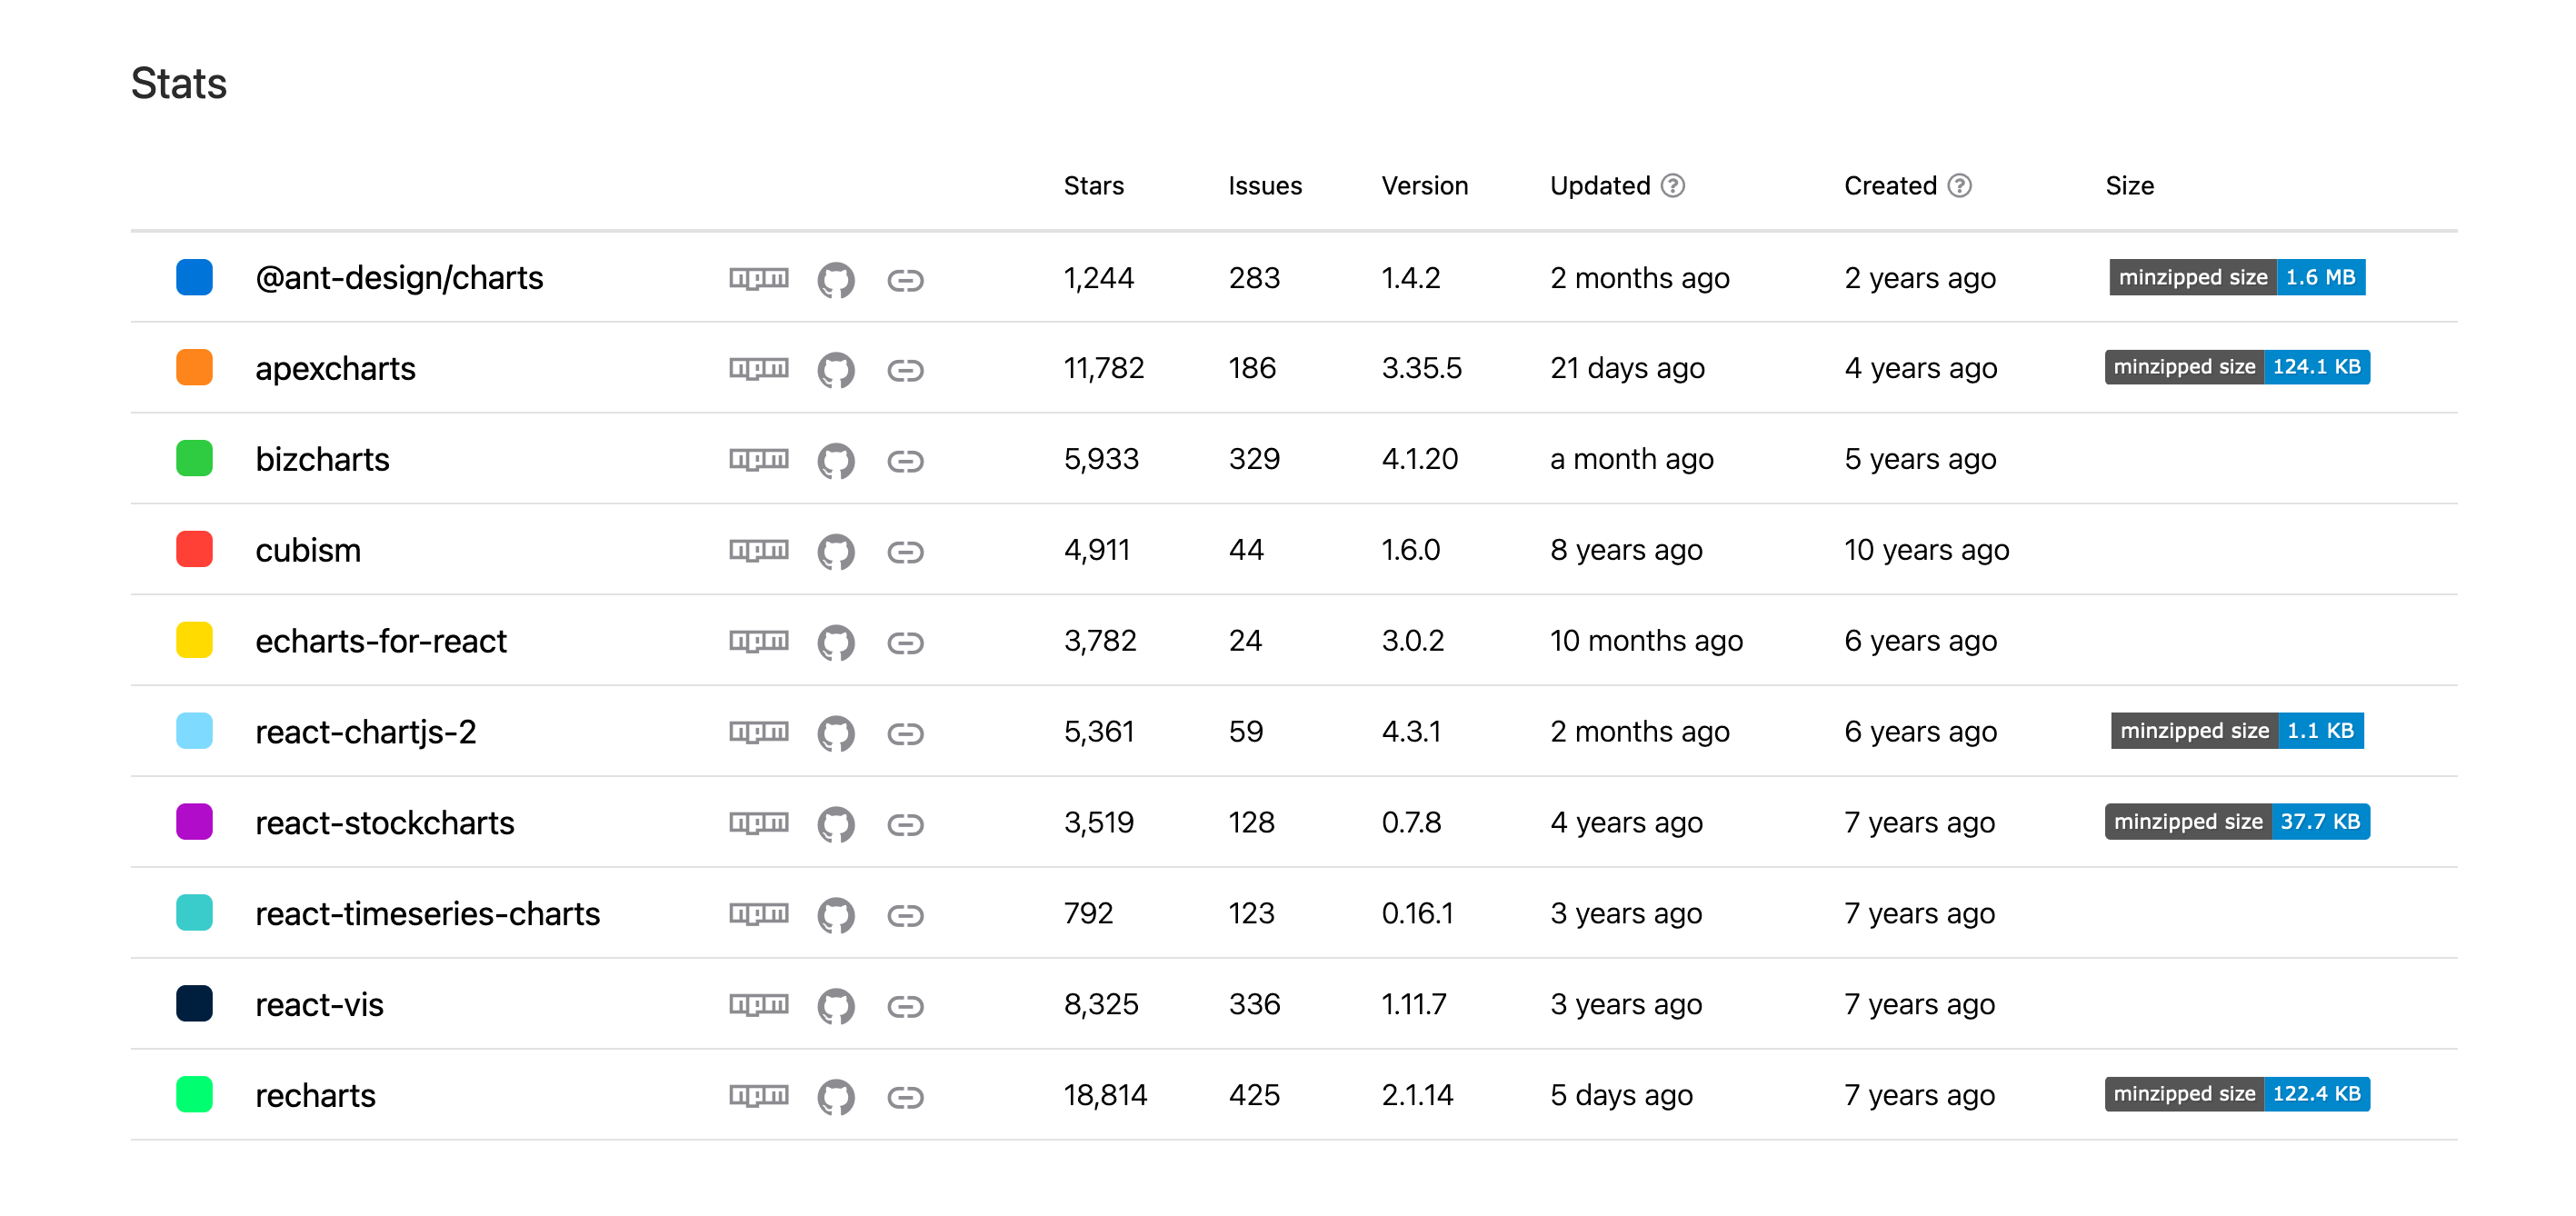
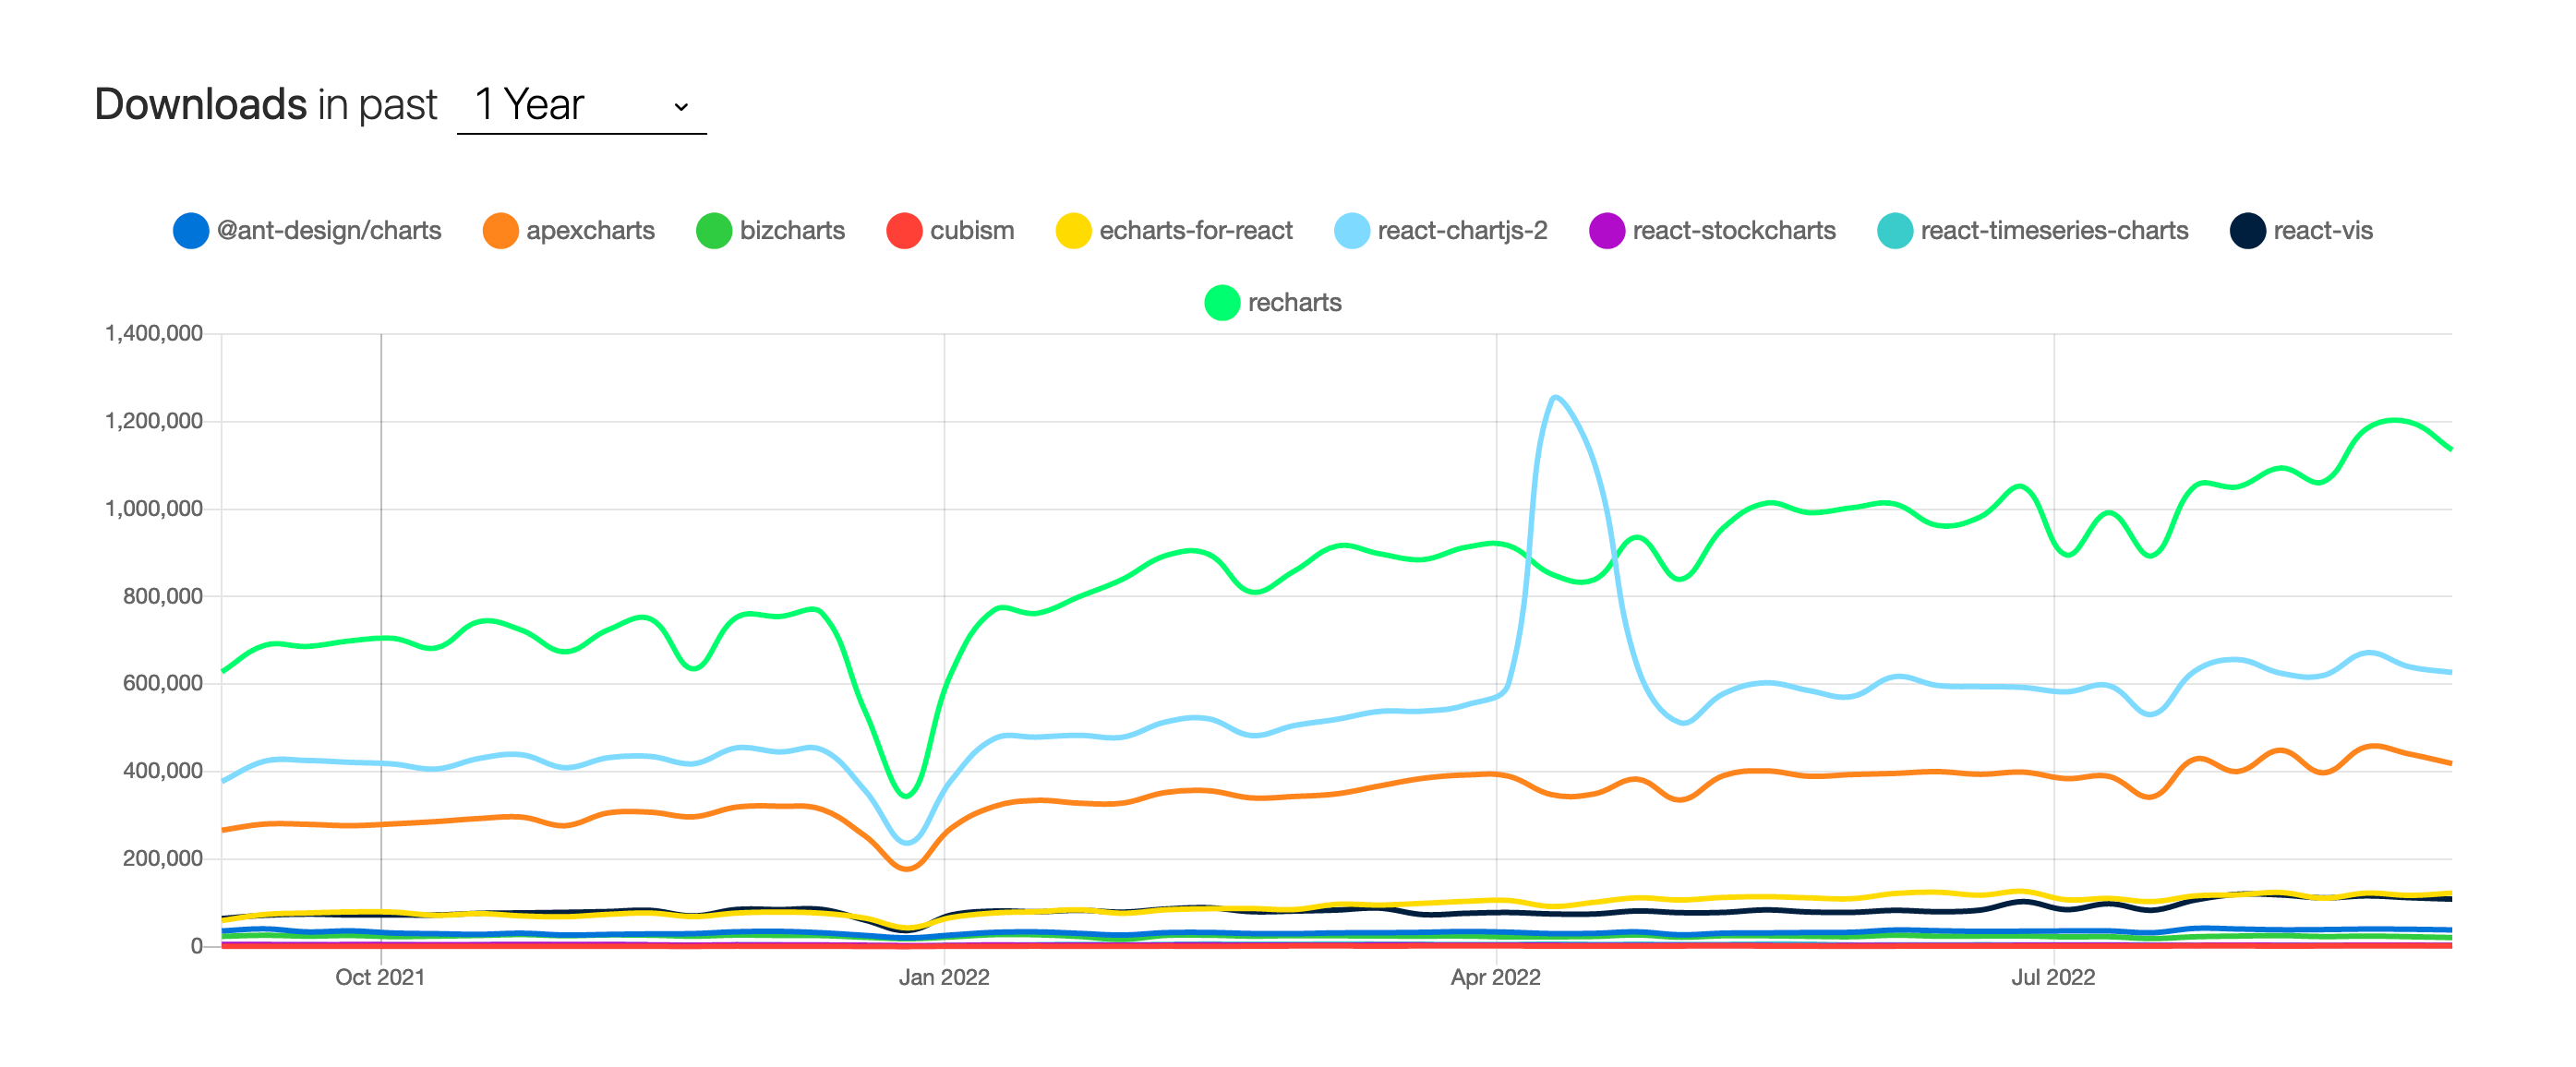
NPM trends is a great place to check the stats and downloads of any chart library before making your final decision on selecting a well-suited chart library for your project.
Did we forget any chart library? Did a new one come around that didn’t make it onto our list in time? Let us know in the comments!
Easily Convert Figma Design to Code
You can build UI faster than your competition with CopyCat. Just copy production-ready code generated directly from Figma designs using CopyCat AI. As a result, you can focus on building interactions, animations, networking, and everything else that will make you stand out. You can be an exceptional front-end developer who develops UI quickly using CopyCat.
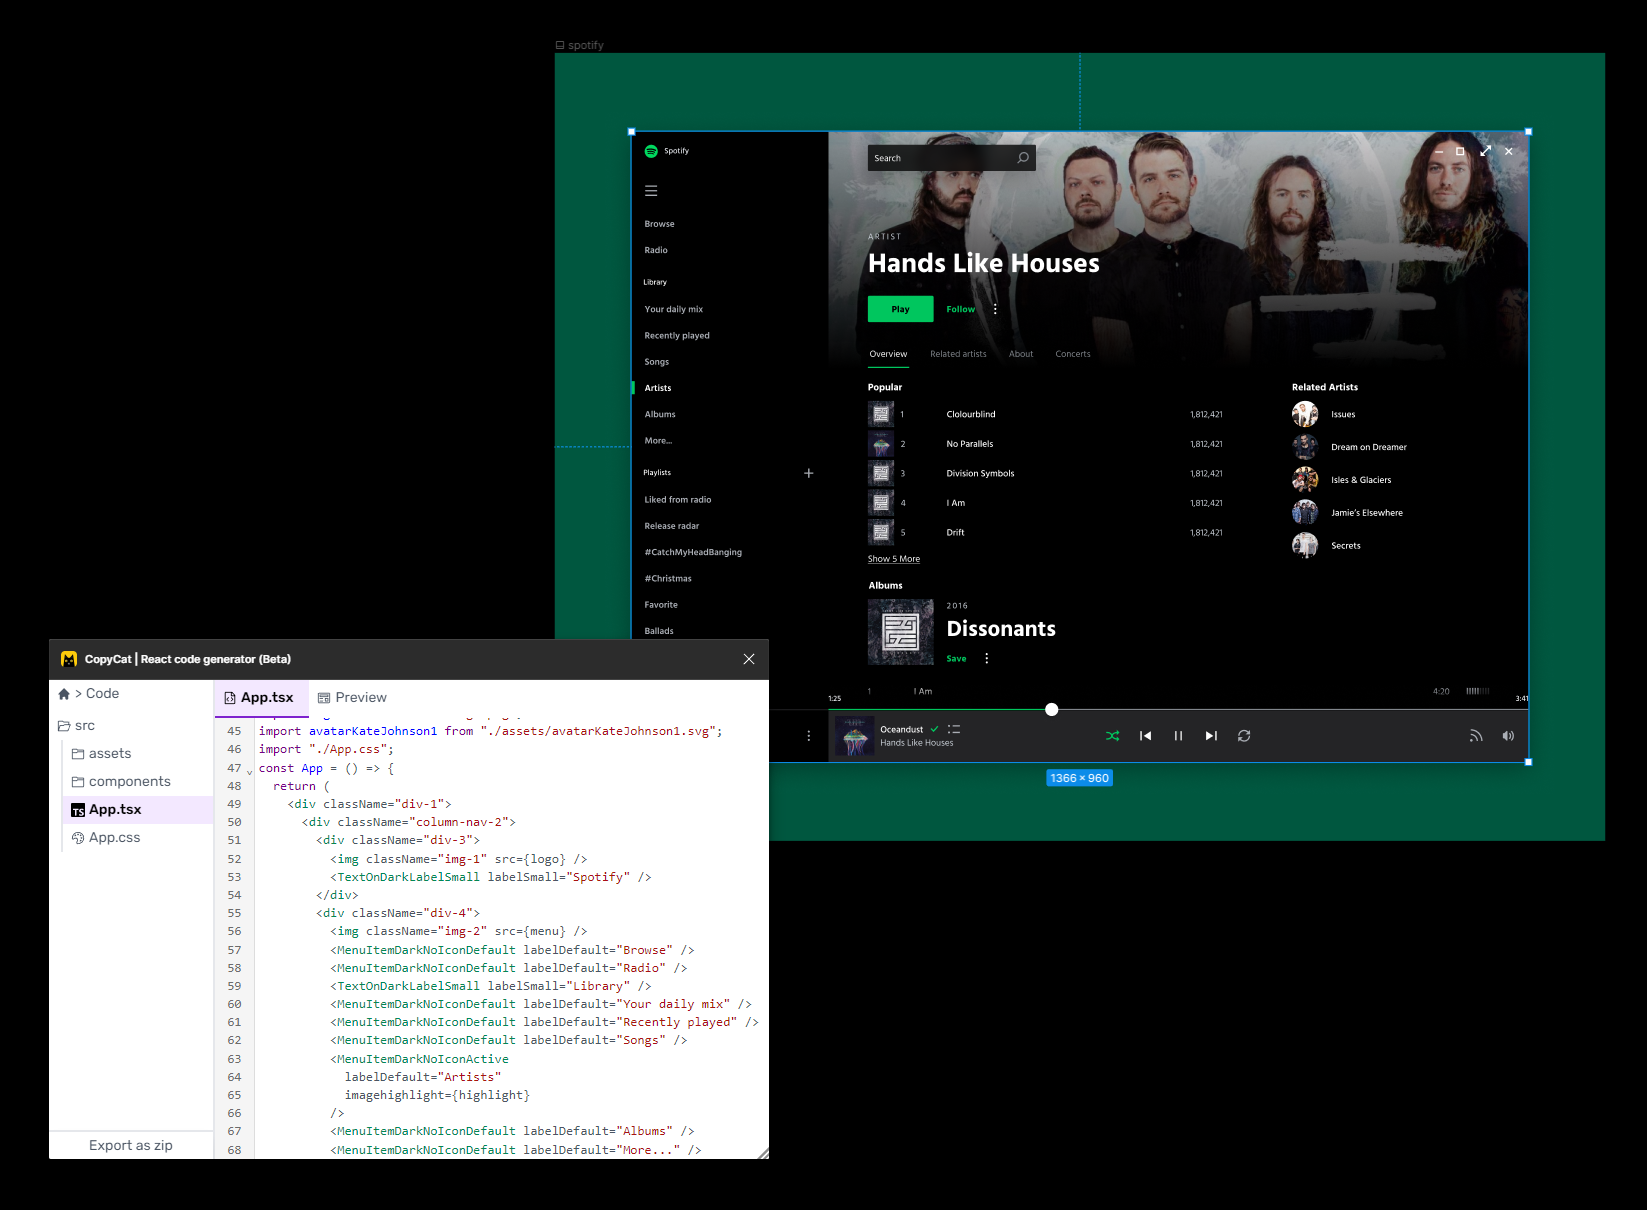
This tool can also help you convert figma designs to tailwind-css projects and react low code if you’re working on an application.
You’ll be 2X faster at developing UI. You’ll meet your deadlines and spend your time solving exciting challenges, too! Best of all, you’ll eliminate sprint delays and design inconsistencies.
Related Articles
-
 React.js
Everything You Need to Know About TypeScript Typeof Operator
Introduction TypeScript is a superset of JavaScript that provides more strict type-checking functionality than JavaScript. TypeScript, like JavaScript, has an inbuilt typeof operator; we’ll look at the operator in TypeScript and how it works differently. What is typeof operator in…
October 31, 2022 -
React.js
React Datepicker Complete Guide With Examples
Introduction Do you want to add a Datepicker to your React application? Most modern web applications require a date and time picker. Whether logging time for employees or choosing a publish date for your blog post, you need a date…
October 14, 2022


